We introduce VERIFY, the first benchmark explicitly designed to assess the
reasoning
path of MLLMs in visual reasoning tasks.
We propose novel metrics that assess reasoning fidelity beyond
accuracy. Our
evaluation reveals critical
limitations in current MLLMs, emphasizing the need for a more balanced approach to perception
and reasoning.
In the color XOR reasoning challenge, O1 takes 1 minute and 20 seconds to propose a solution that
ultimately proves incorrect (answer is B). Note: the video plays at normal speed.
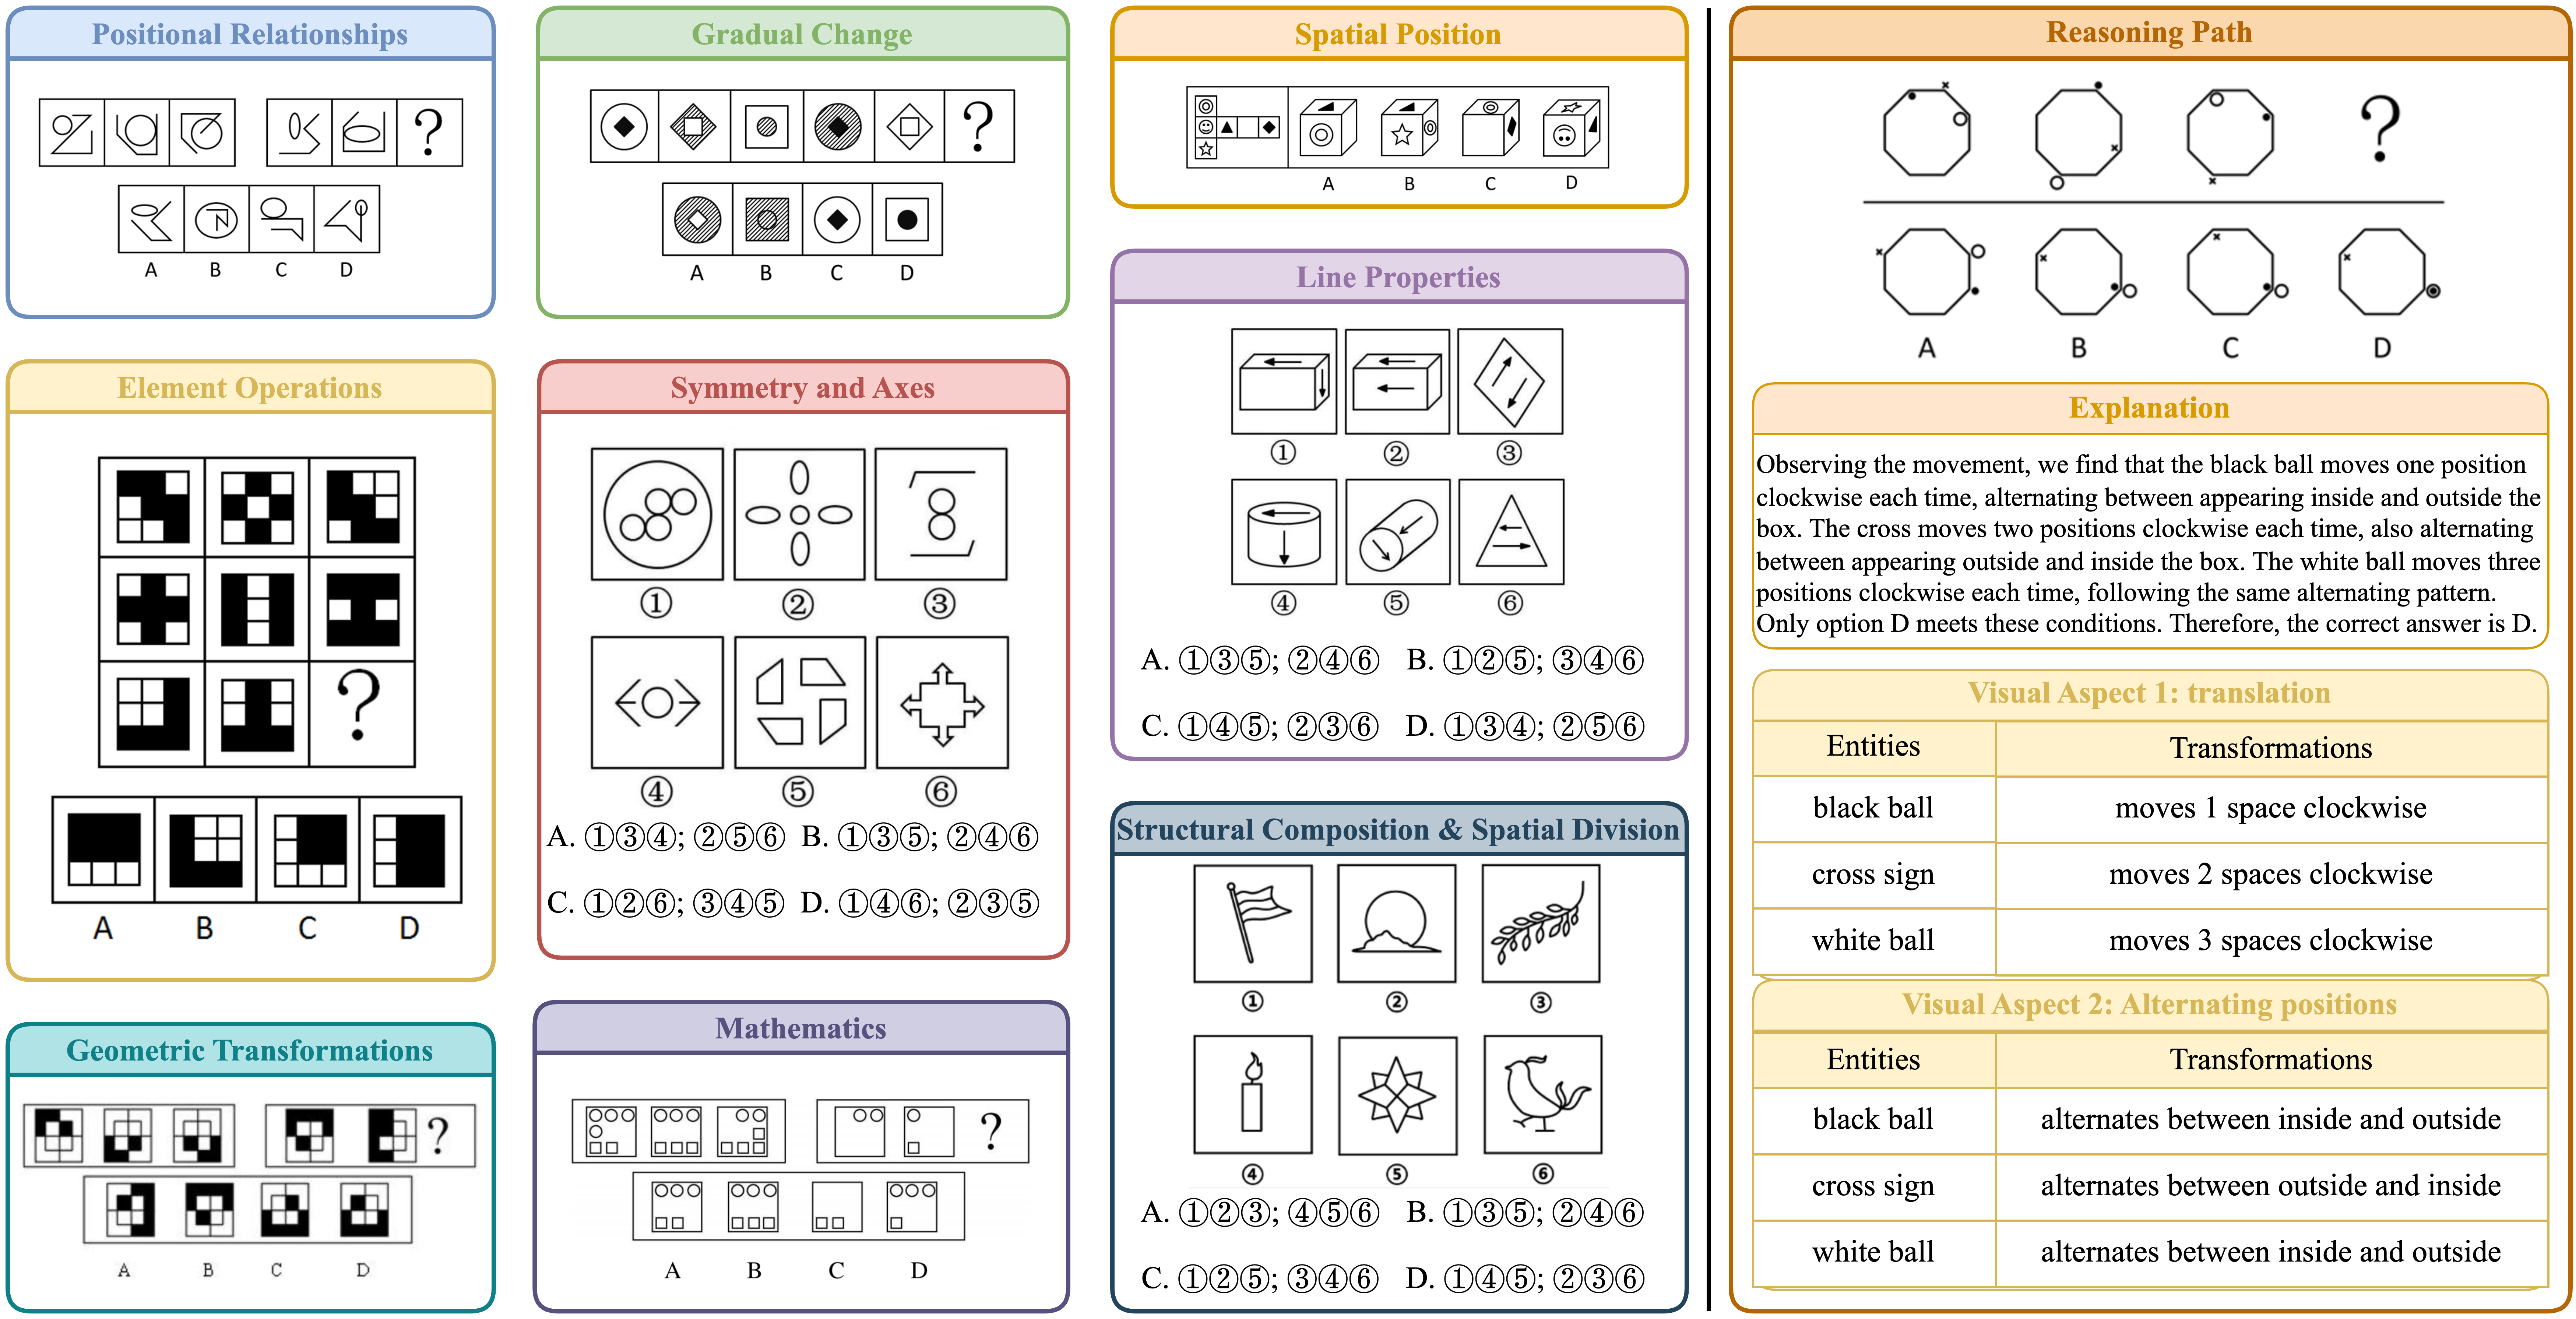
I. Data
Categories from the VERIFY dataset cover a range of patterns, from logical operations to 3D geometry and
mathematics.
The right panel presents a human reasoning path, demonstrating how visual transformations, rotations, and
inside-outside
shifts lead to the final answer. We encourage readers to test these examples with MLLM models (e.g., O1 or Gemini) to assess their reasoning capabilities.
II. Metrics
Limitations of Current Methods
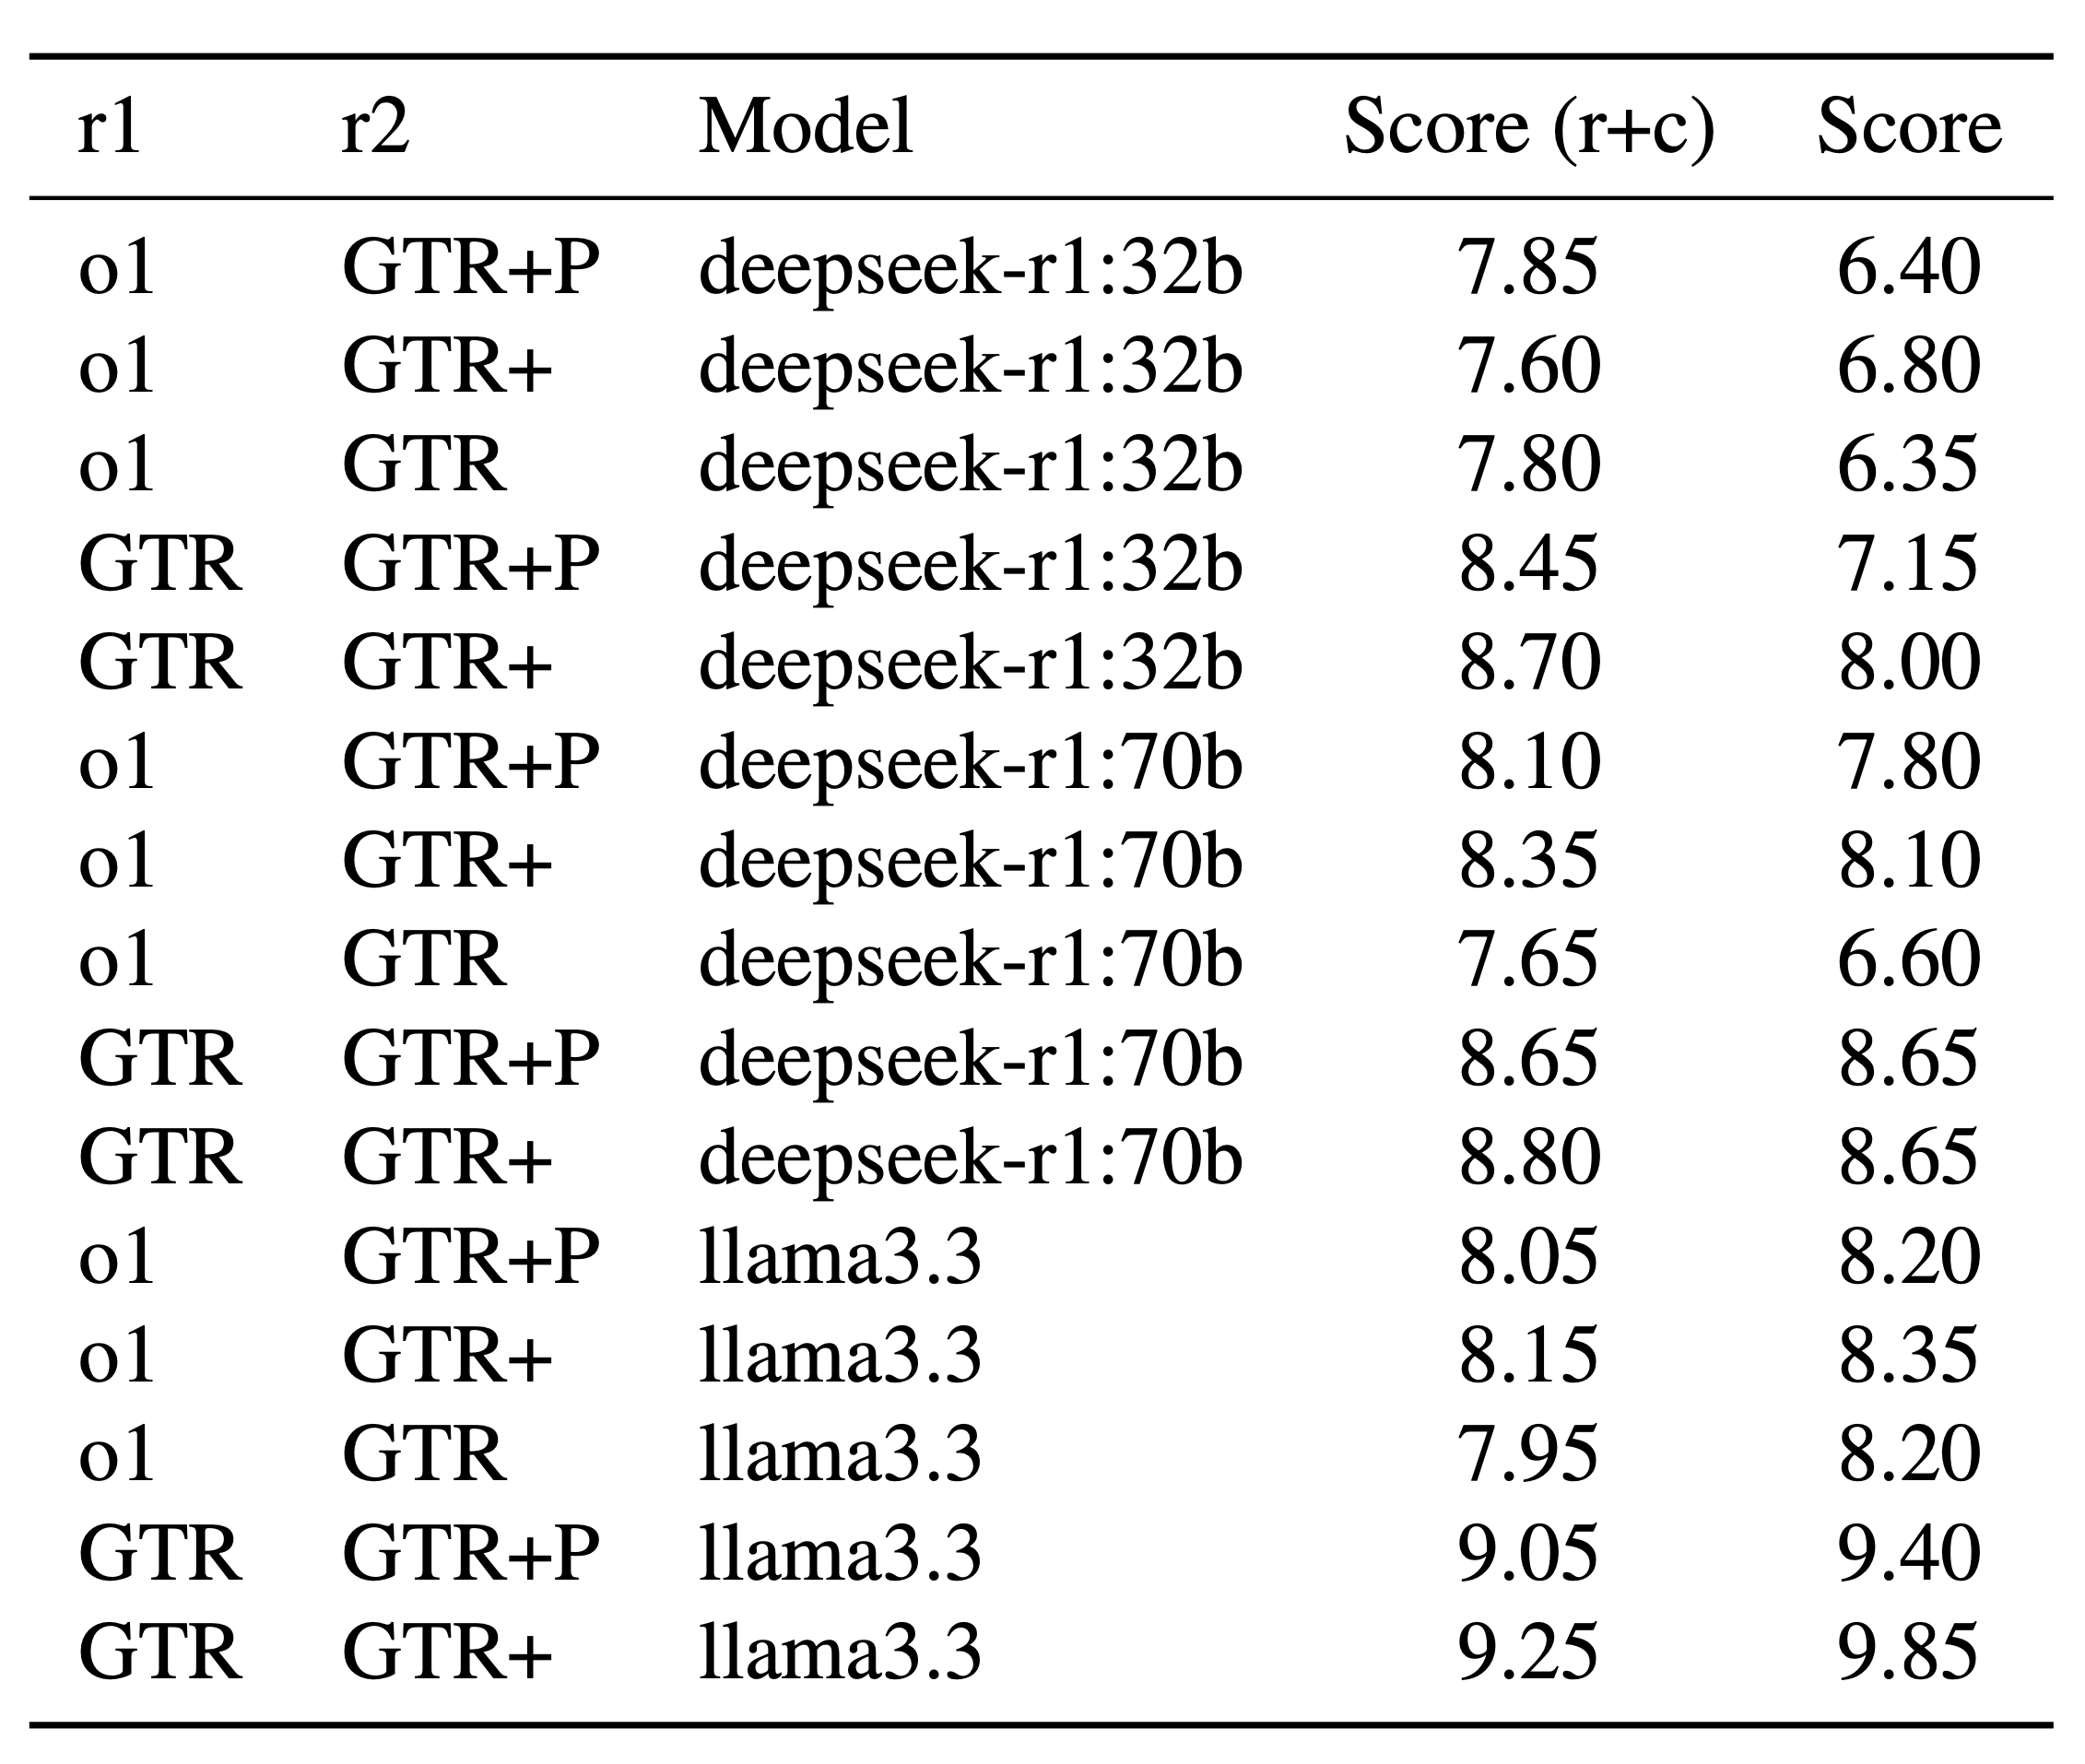
The current LLM, when used as a judge, struggles to accurately compare reasoning paths. Even with an
accuracy of only 15%, it still assigns high scores. Moreover, even recent reasoning models have difficulty
differentiating the O1 response.
from the ground truth reasoning (GTR).
GTR represents the ground truth reasoning path, while GTR+ is a refined, structured extension of GTP and
GTP+P that incorporates human-labeled visual pattern annotations.
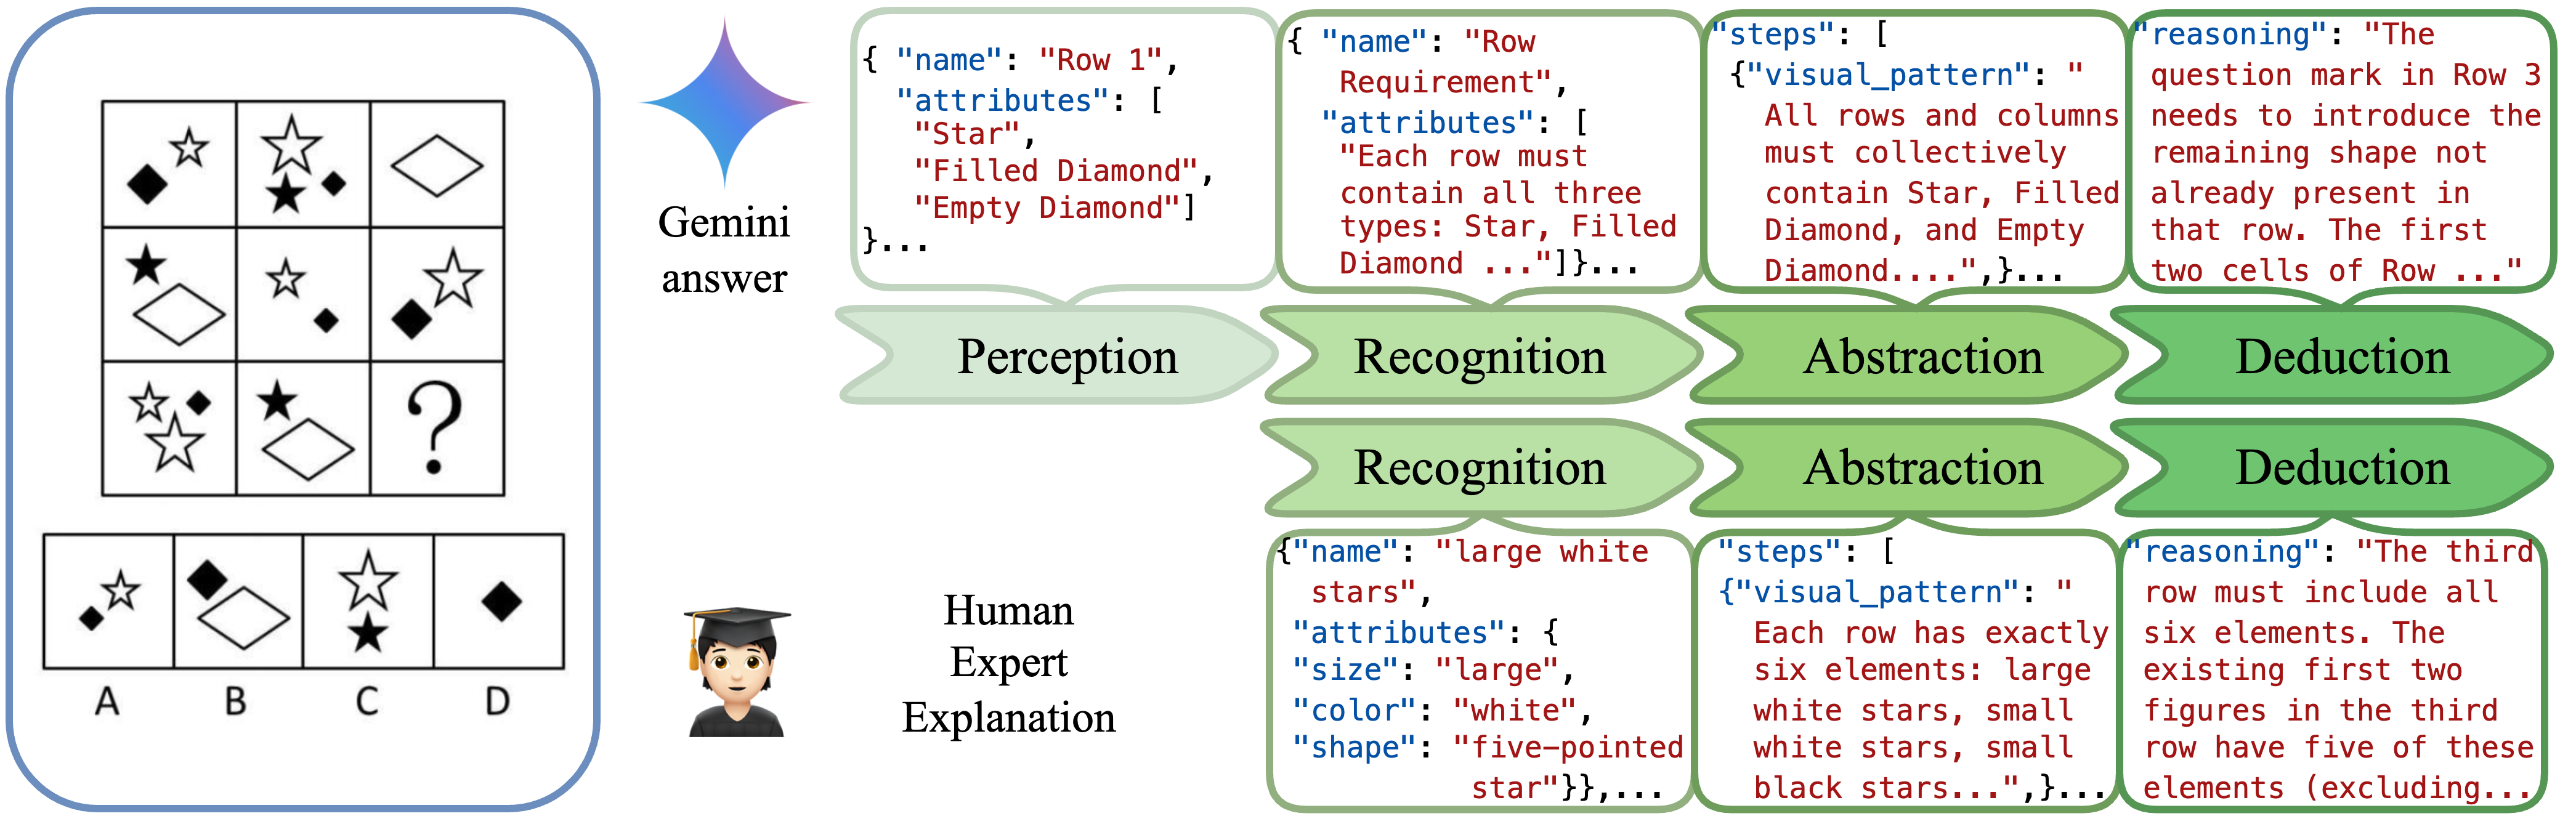
Reasoning Path
We divide the reasoning process into four key stages inspired by human visual reasoning: perception,
recognition,
abstraction, and deduction. Unlike general visual tasks, where perception involves detecting raw visual
features, humans
often have implicit perception because the provided visual elements are already structured for direct
recognition of
useful components. Even for shown complex problems, a model with strong visual abilities—like Gemini—can
effectively
analyze patterns and logical structures to determine the correct answer.
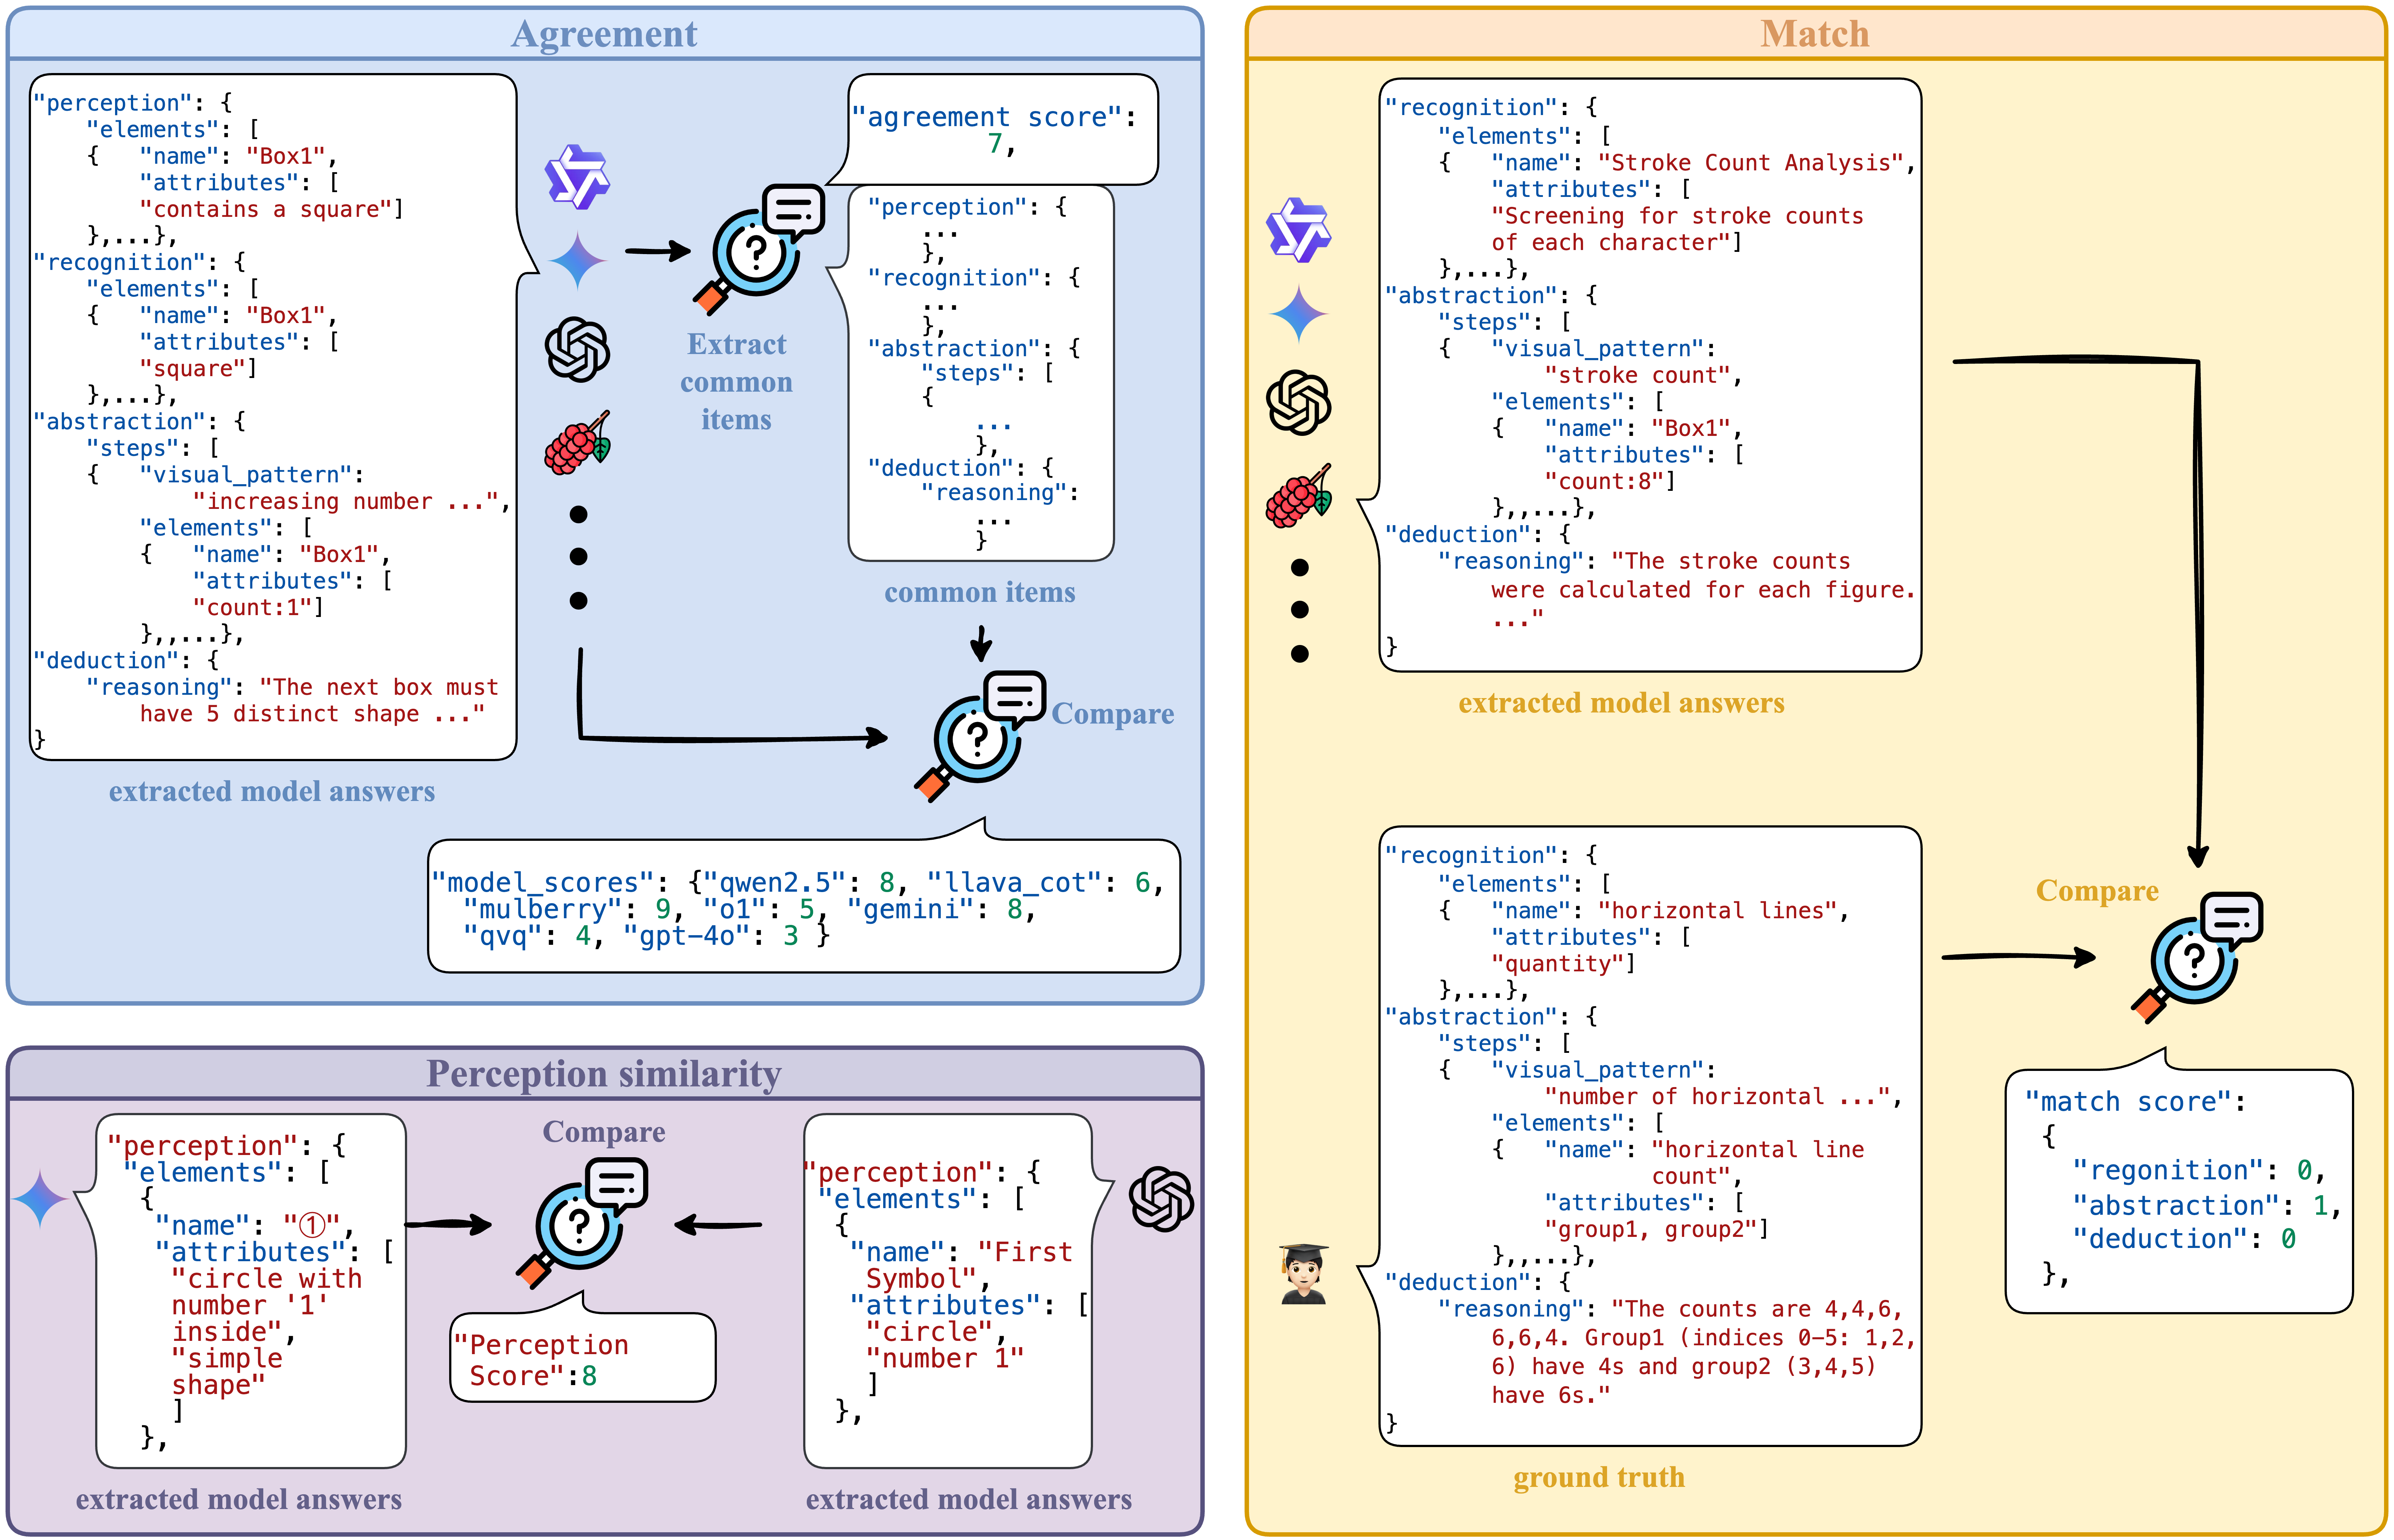
Reasoning Fidelity
This diagram illustrates three proposed evaluation metrics: Agreement, which extracts common elements across
model
answers and compares their consistency; Match, which assesses alignment between model responses and ground
truth across
Recognition, Abstraction, and Deduction; and Perception Similarity, which measures the similarity of
extracted
perception attributes across different models.
III. Result
The first row visualizes the correlation between Recognition (R) and Abstraction
(A), while the second examines the transition from Abstraction (A) to
Deduction (D). Bubble sizes represent confidence levels.
This figure highlights inter-model variability, with stronger correlations in R → A than A → D,
indicating challenges in applying logical deduction even when abstraction is well-formed.
Model Performance and Alignment
We have also included a radar chart for a quick comparison of model performance, highlighting variations
across key reasoning and perception dimensions. Notably, models such as Qwen2.5 and GPT-4o show higher
agreement scores, suggesting a stronger consensus in visual perception, while o1 achieves relatively higher
abstraction and deduction scores, demonstrating superior reasoning capabilities.
On the right, it's a pairwise similarity matrix comparing model responses. Notably, gemini and 4o exhibit
the strongest perceptual alignment, suggesting these models process visual data in a similar way. In
contrast, qvq shows the weakest alignment with both llava and O1, indicating a distinctly different
interpretation of visual inputs. Additionally, 4o and qwen display relatively strong alignment with several
models, highlighting their broader generalizability, while O1 maintains moderate alignment without
dominating similarity with any one model.
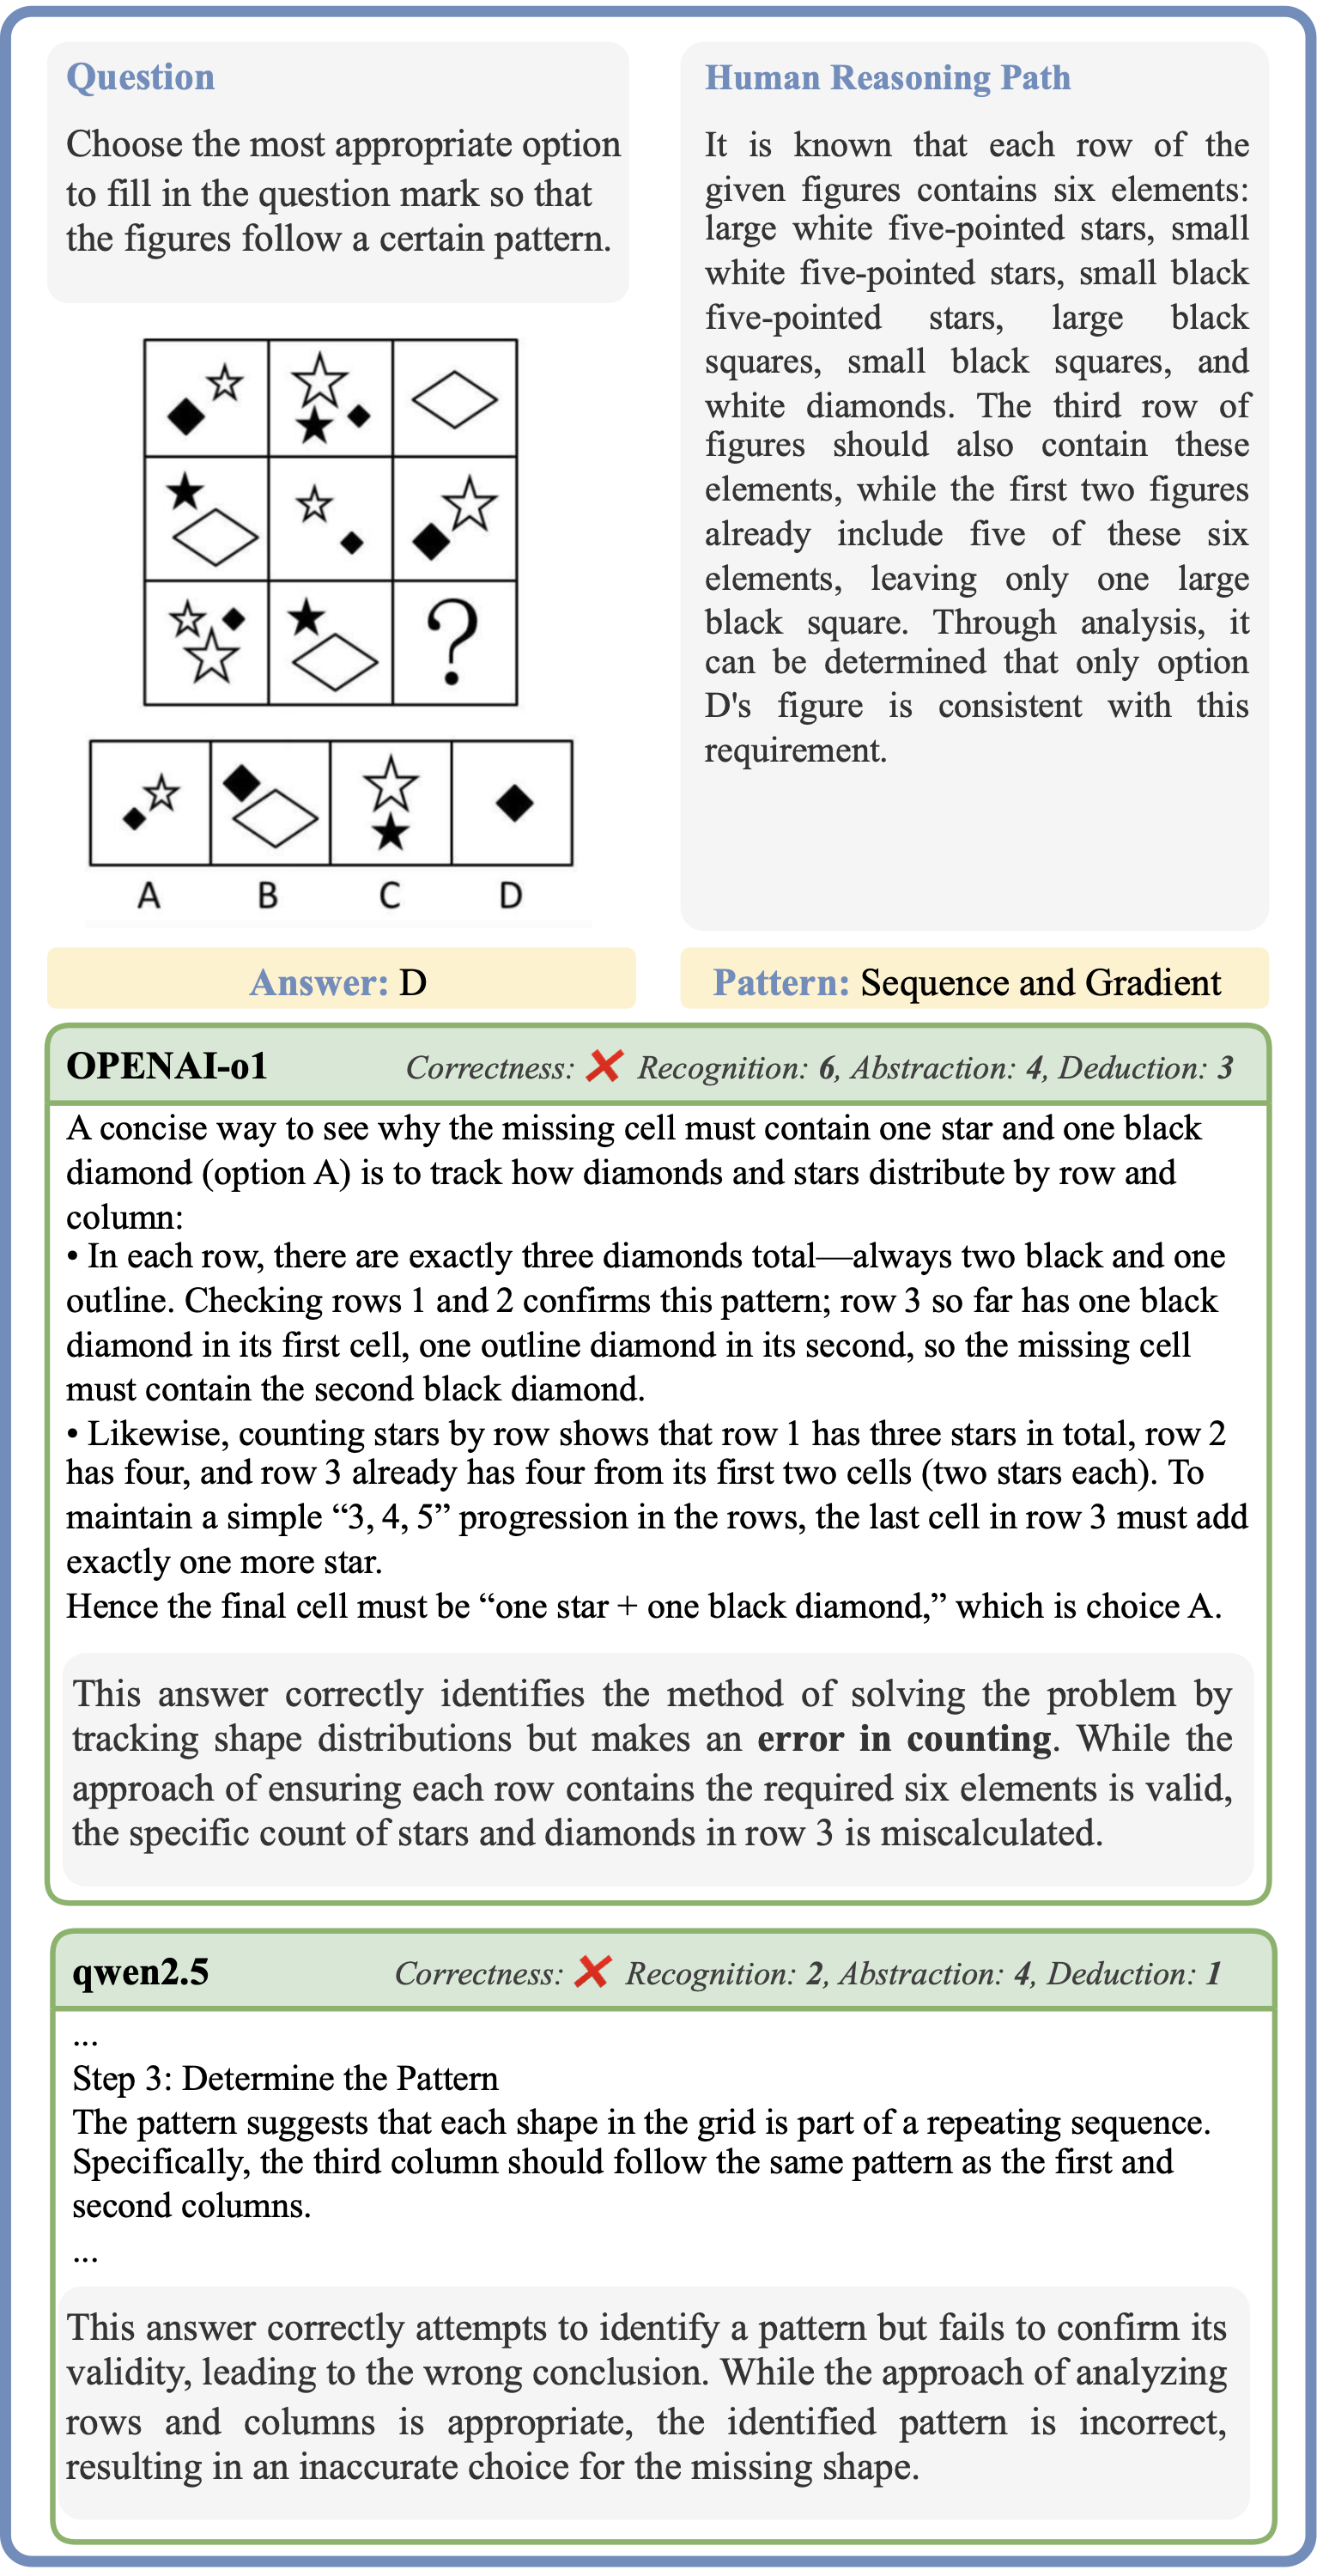
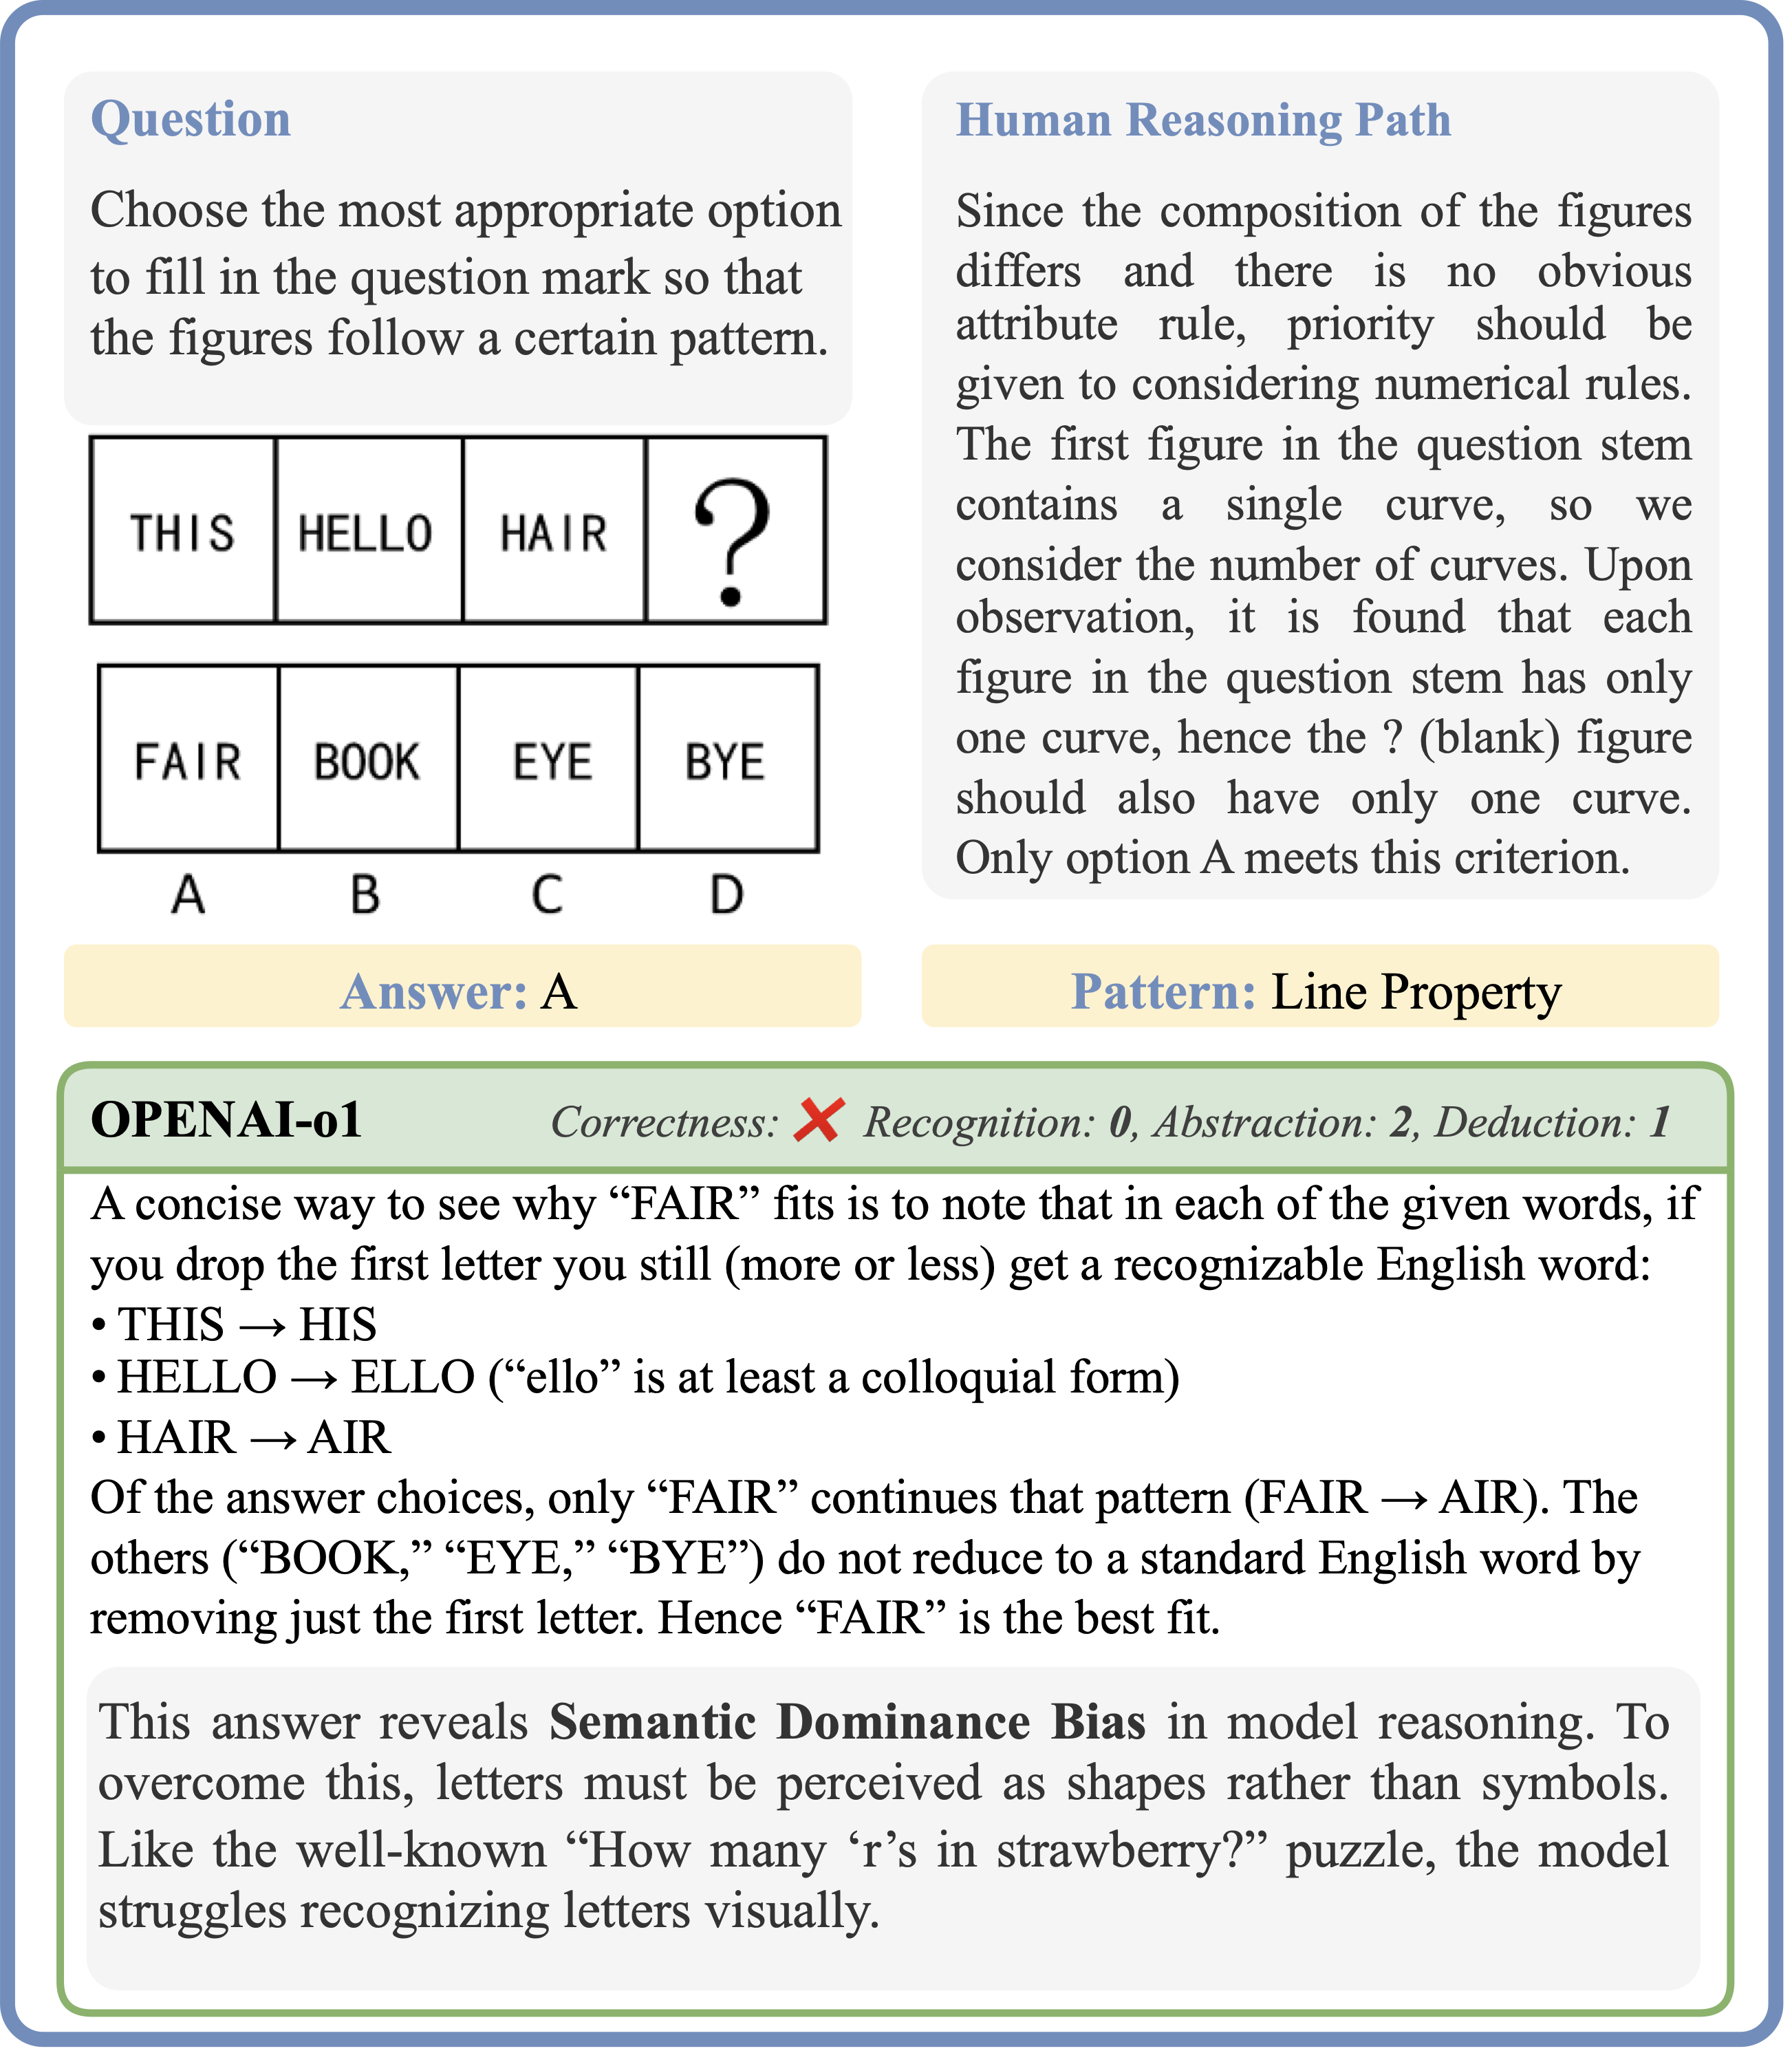
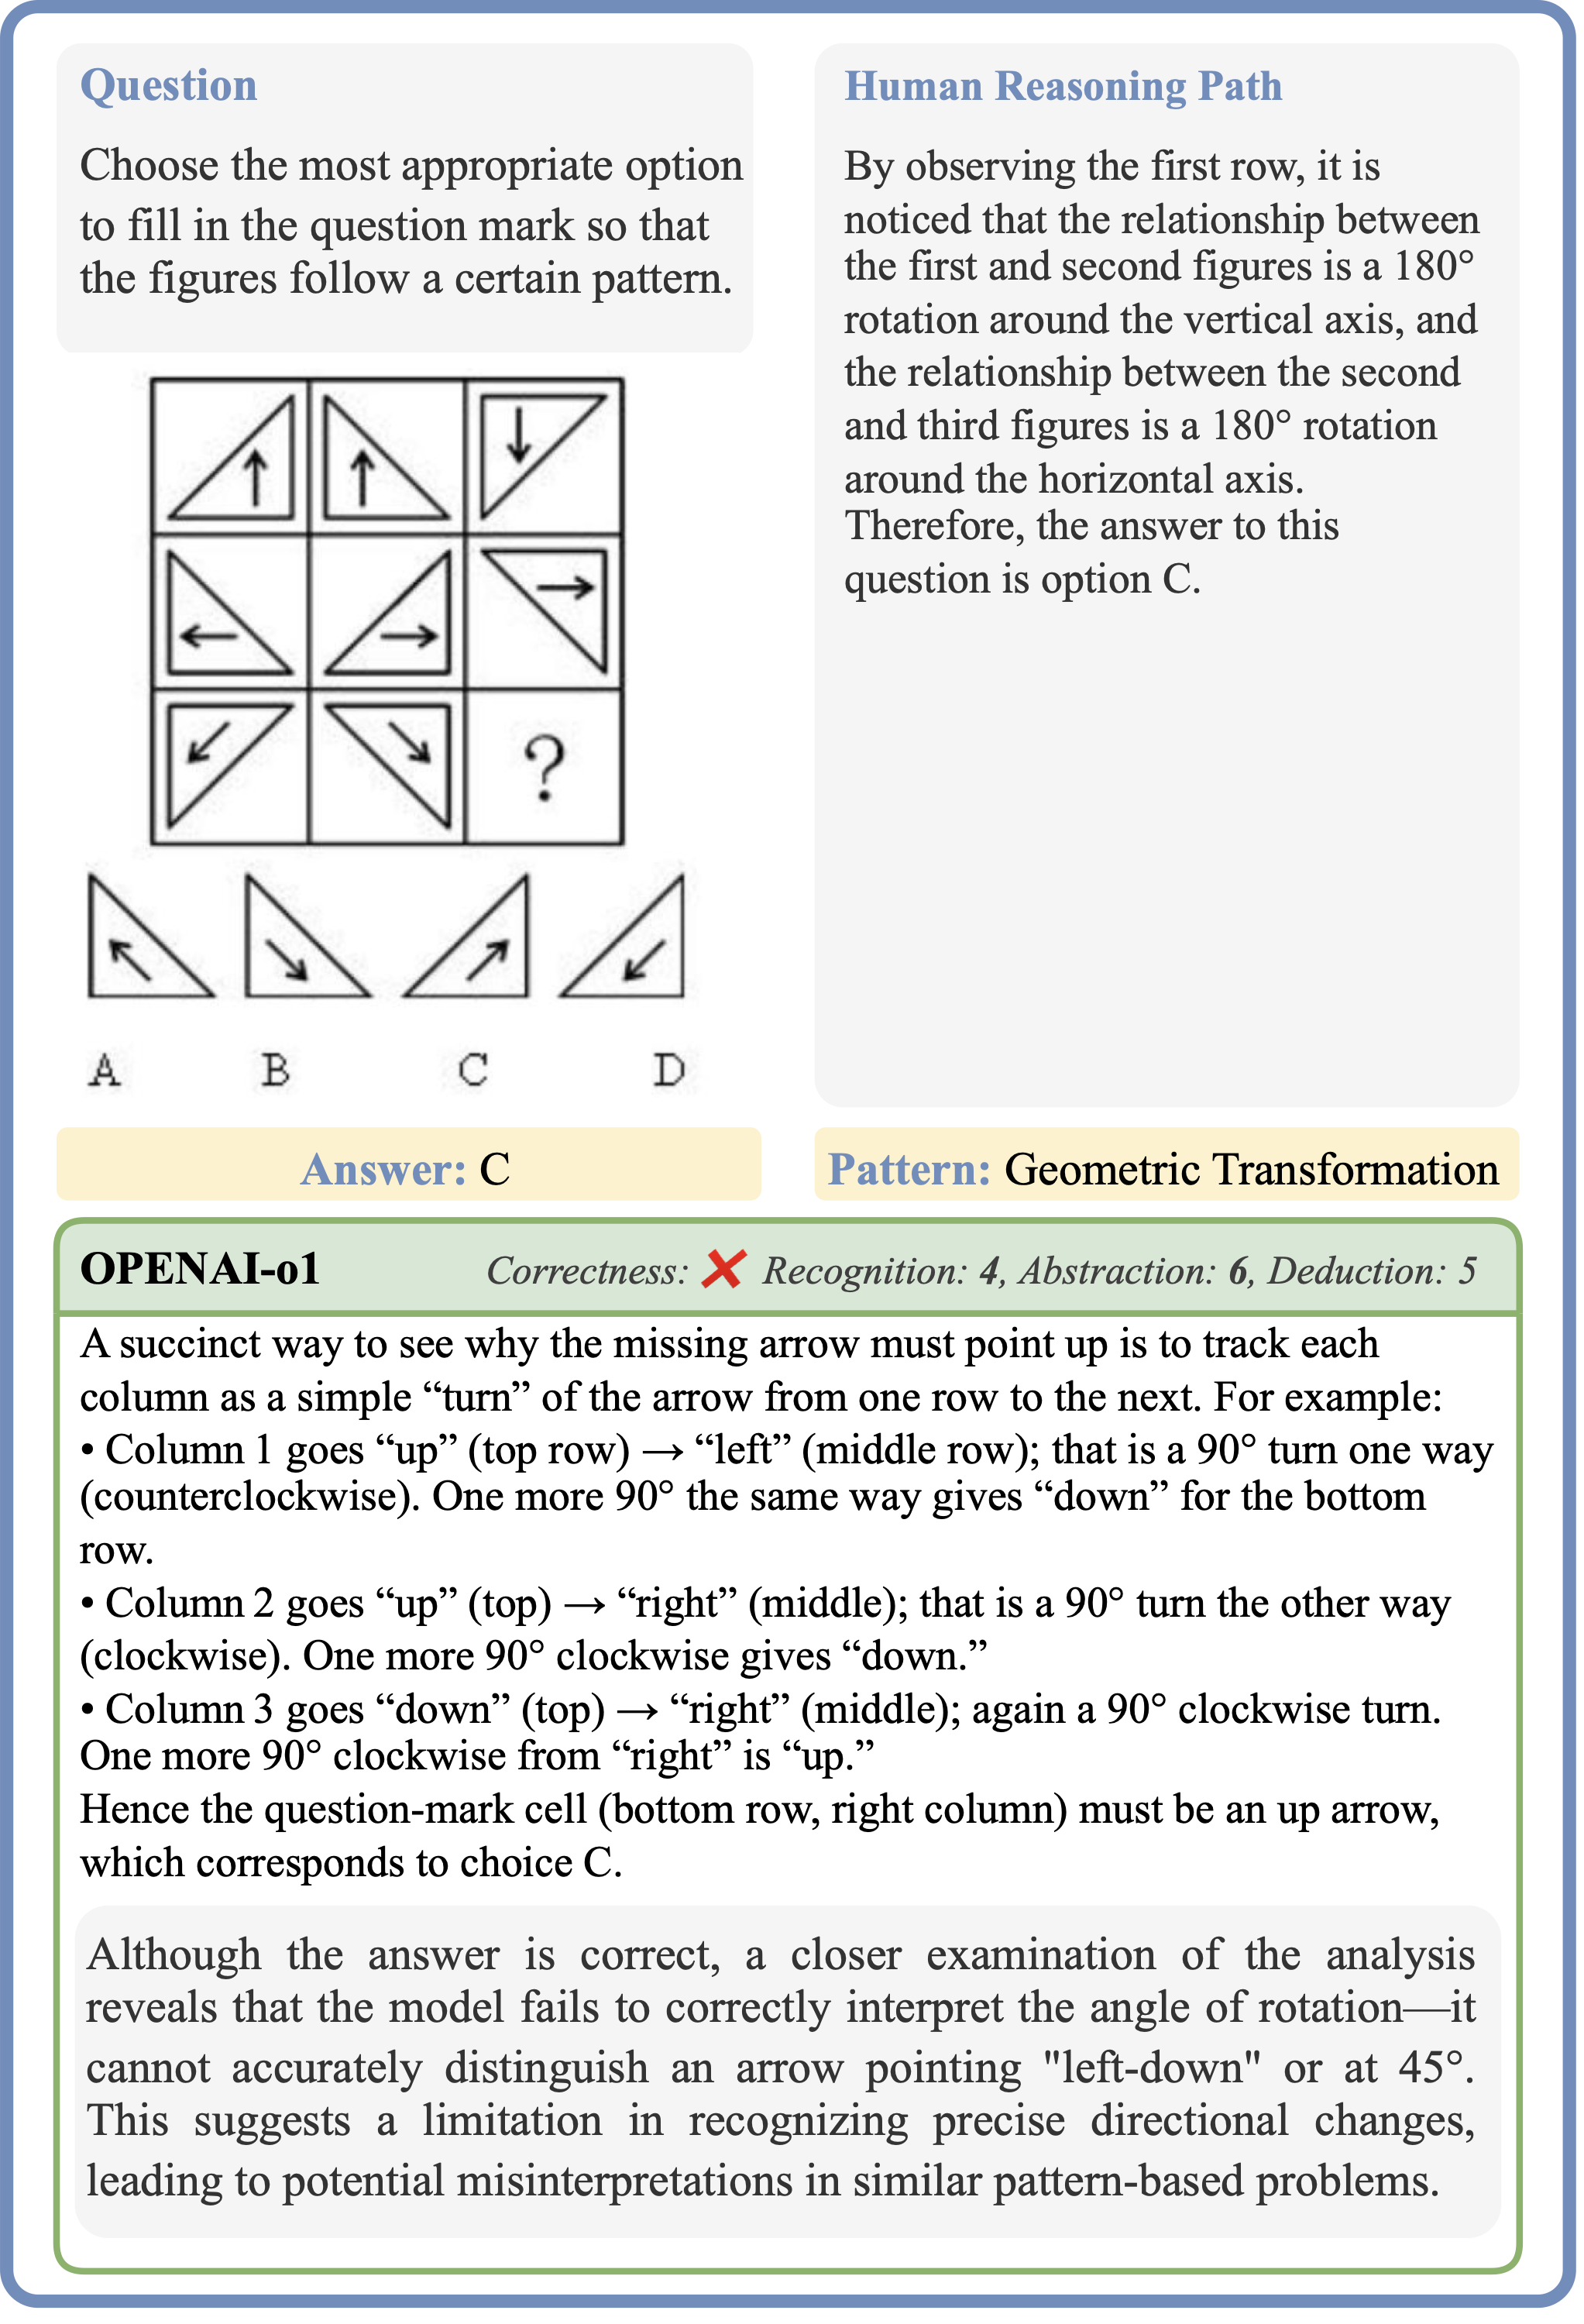
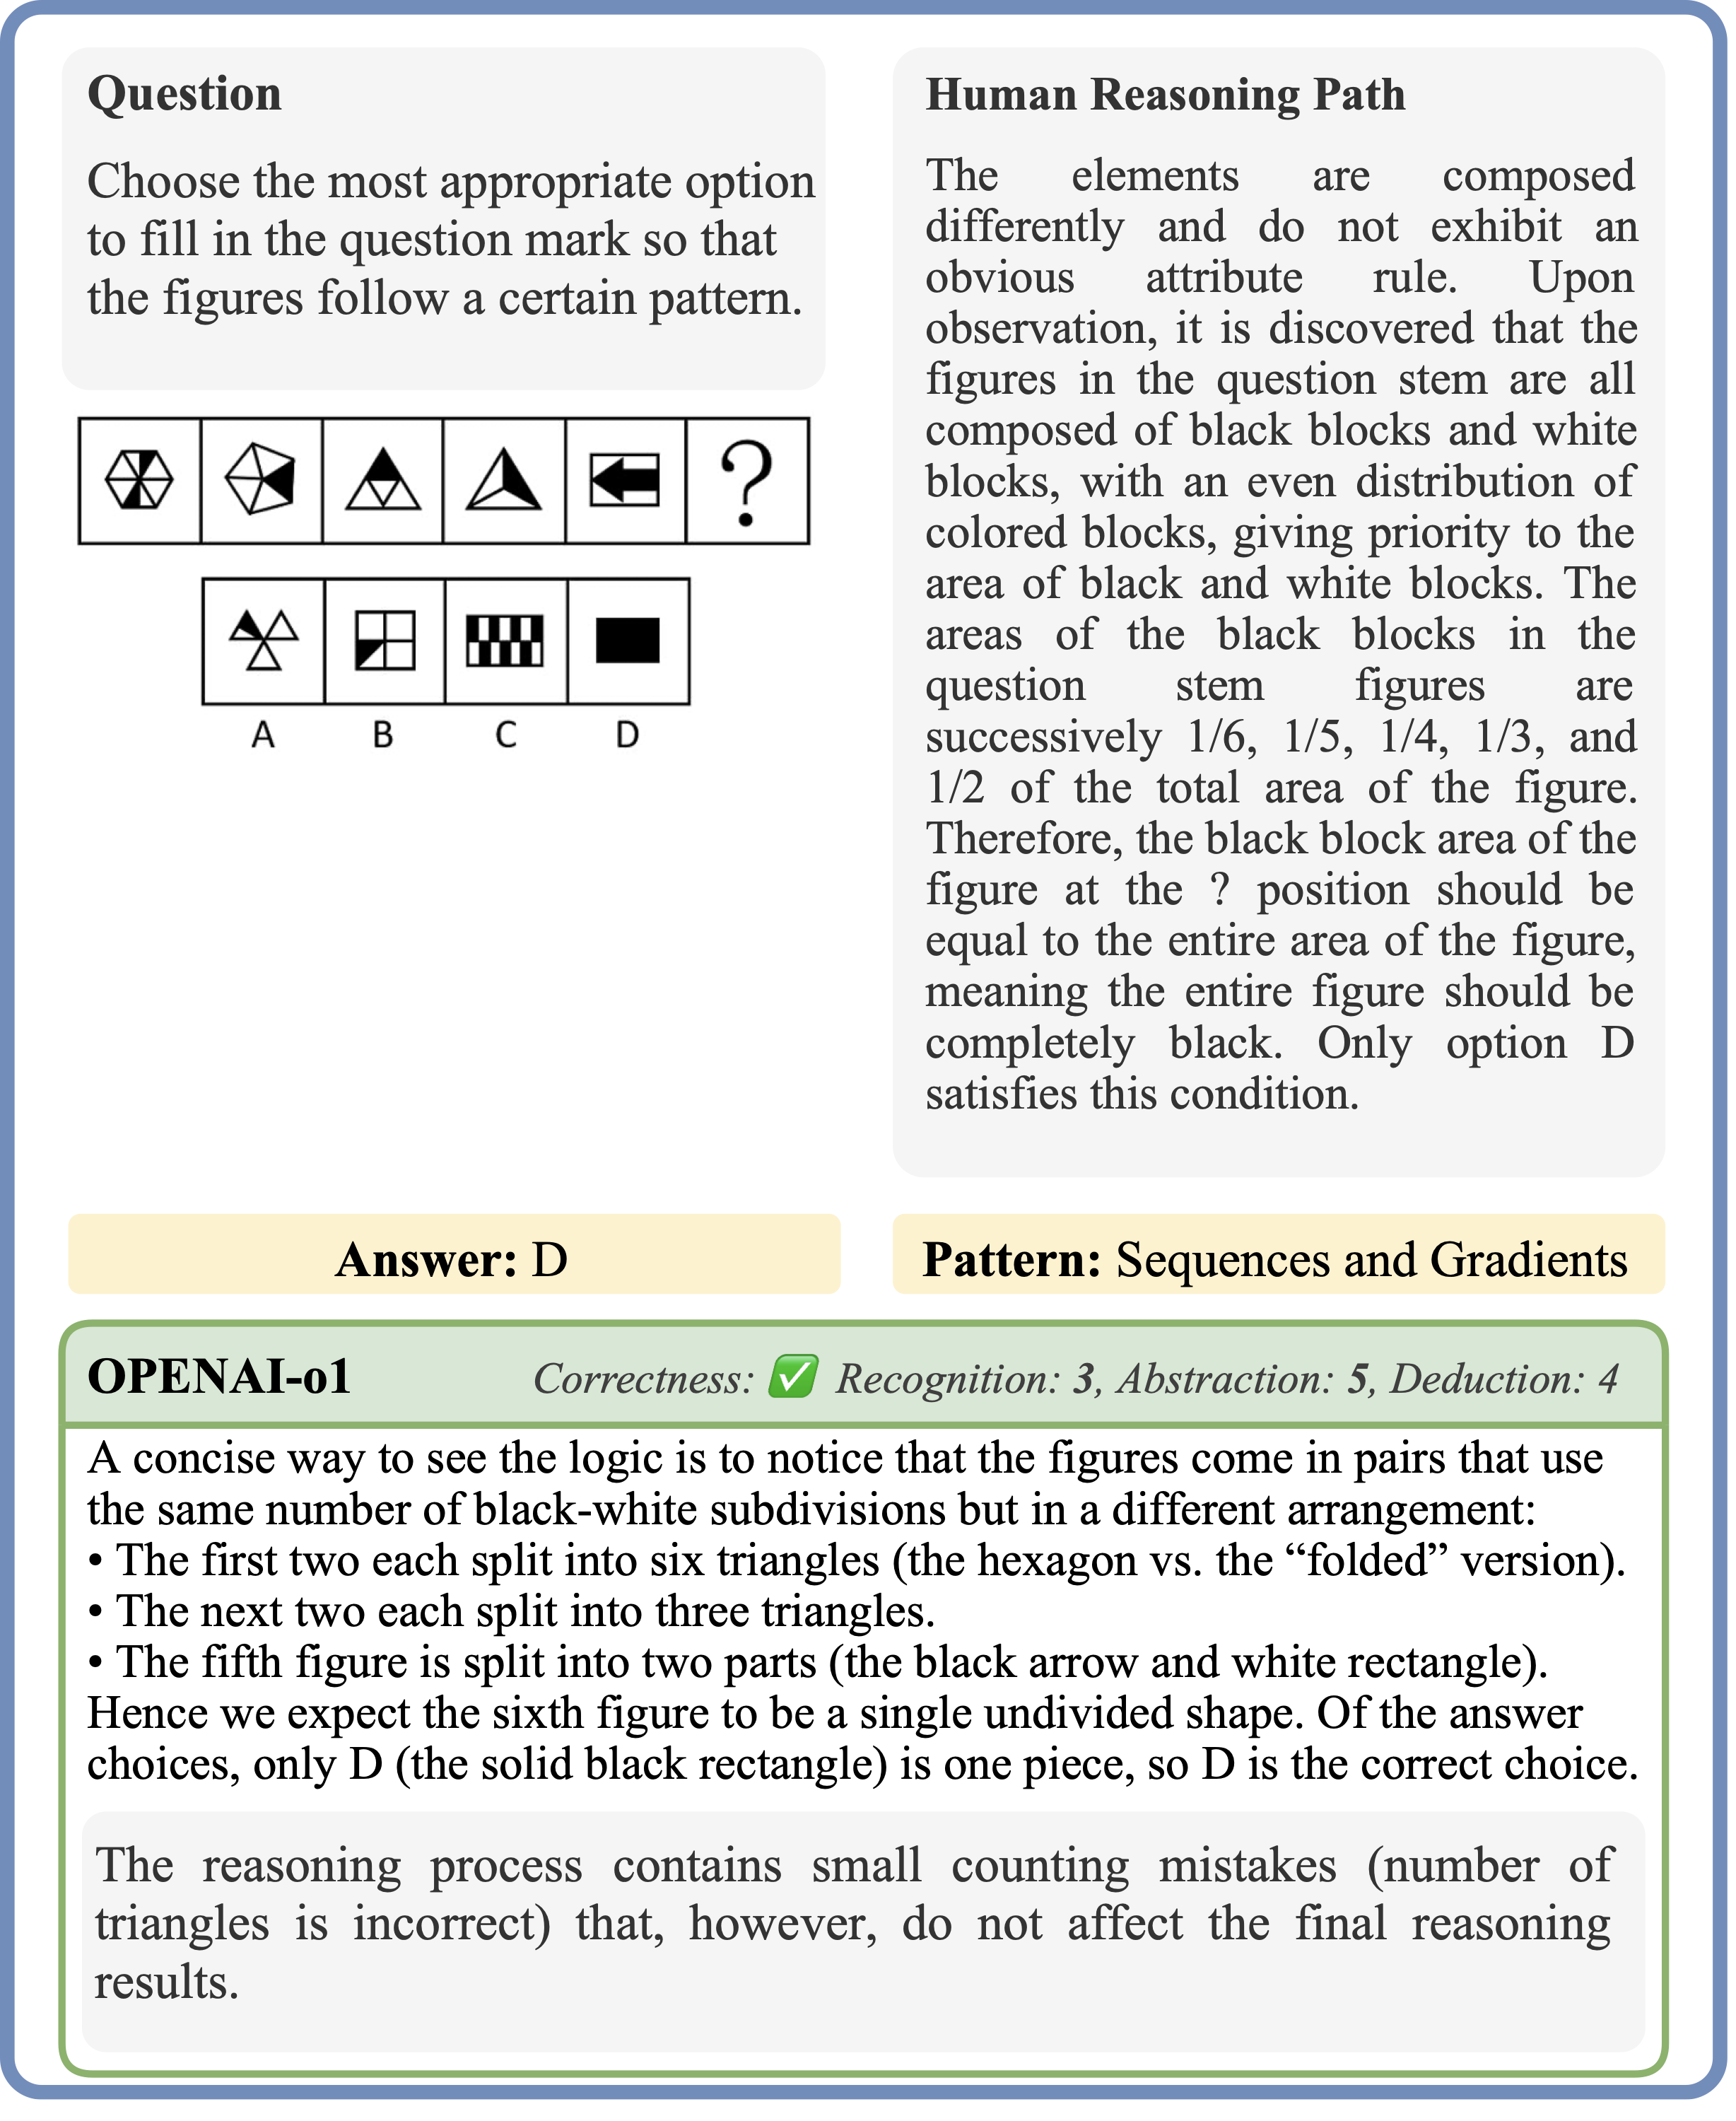
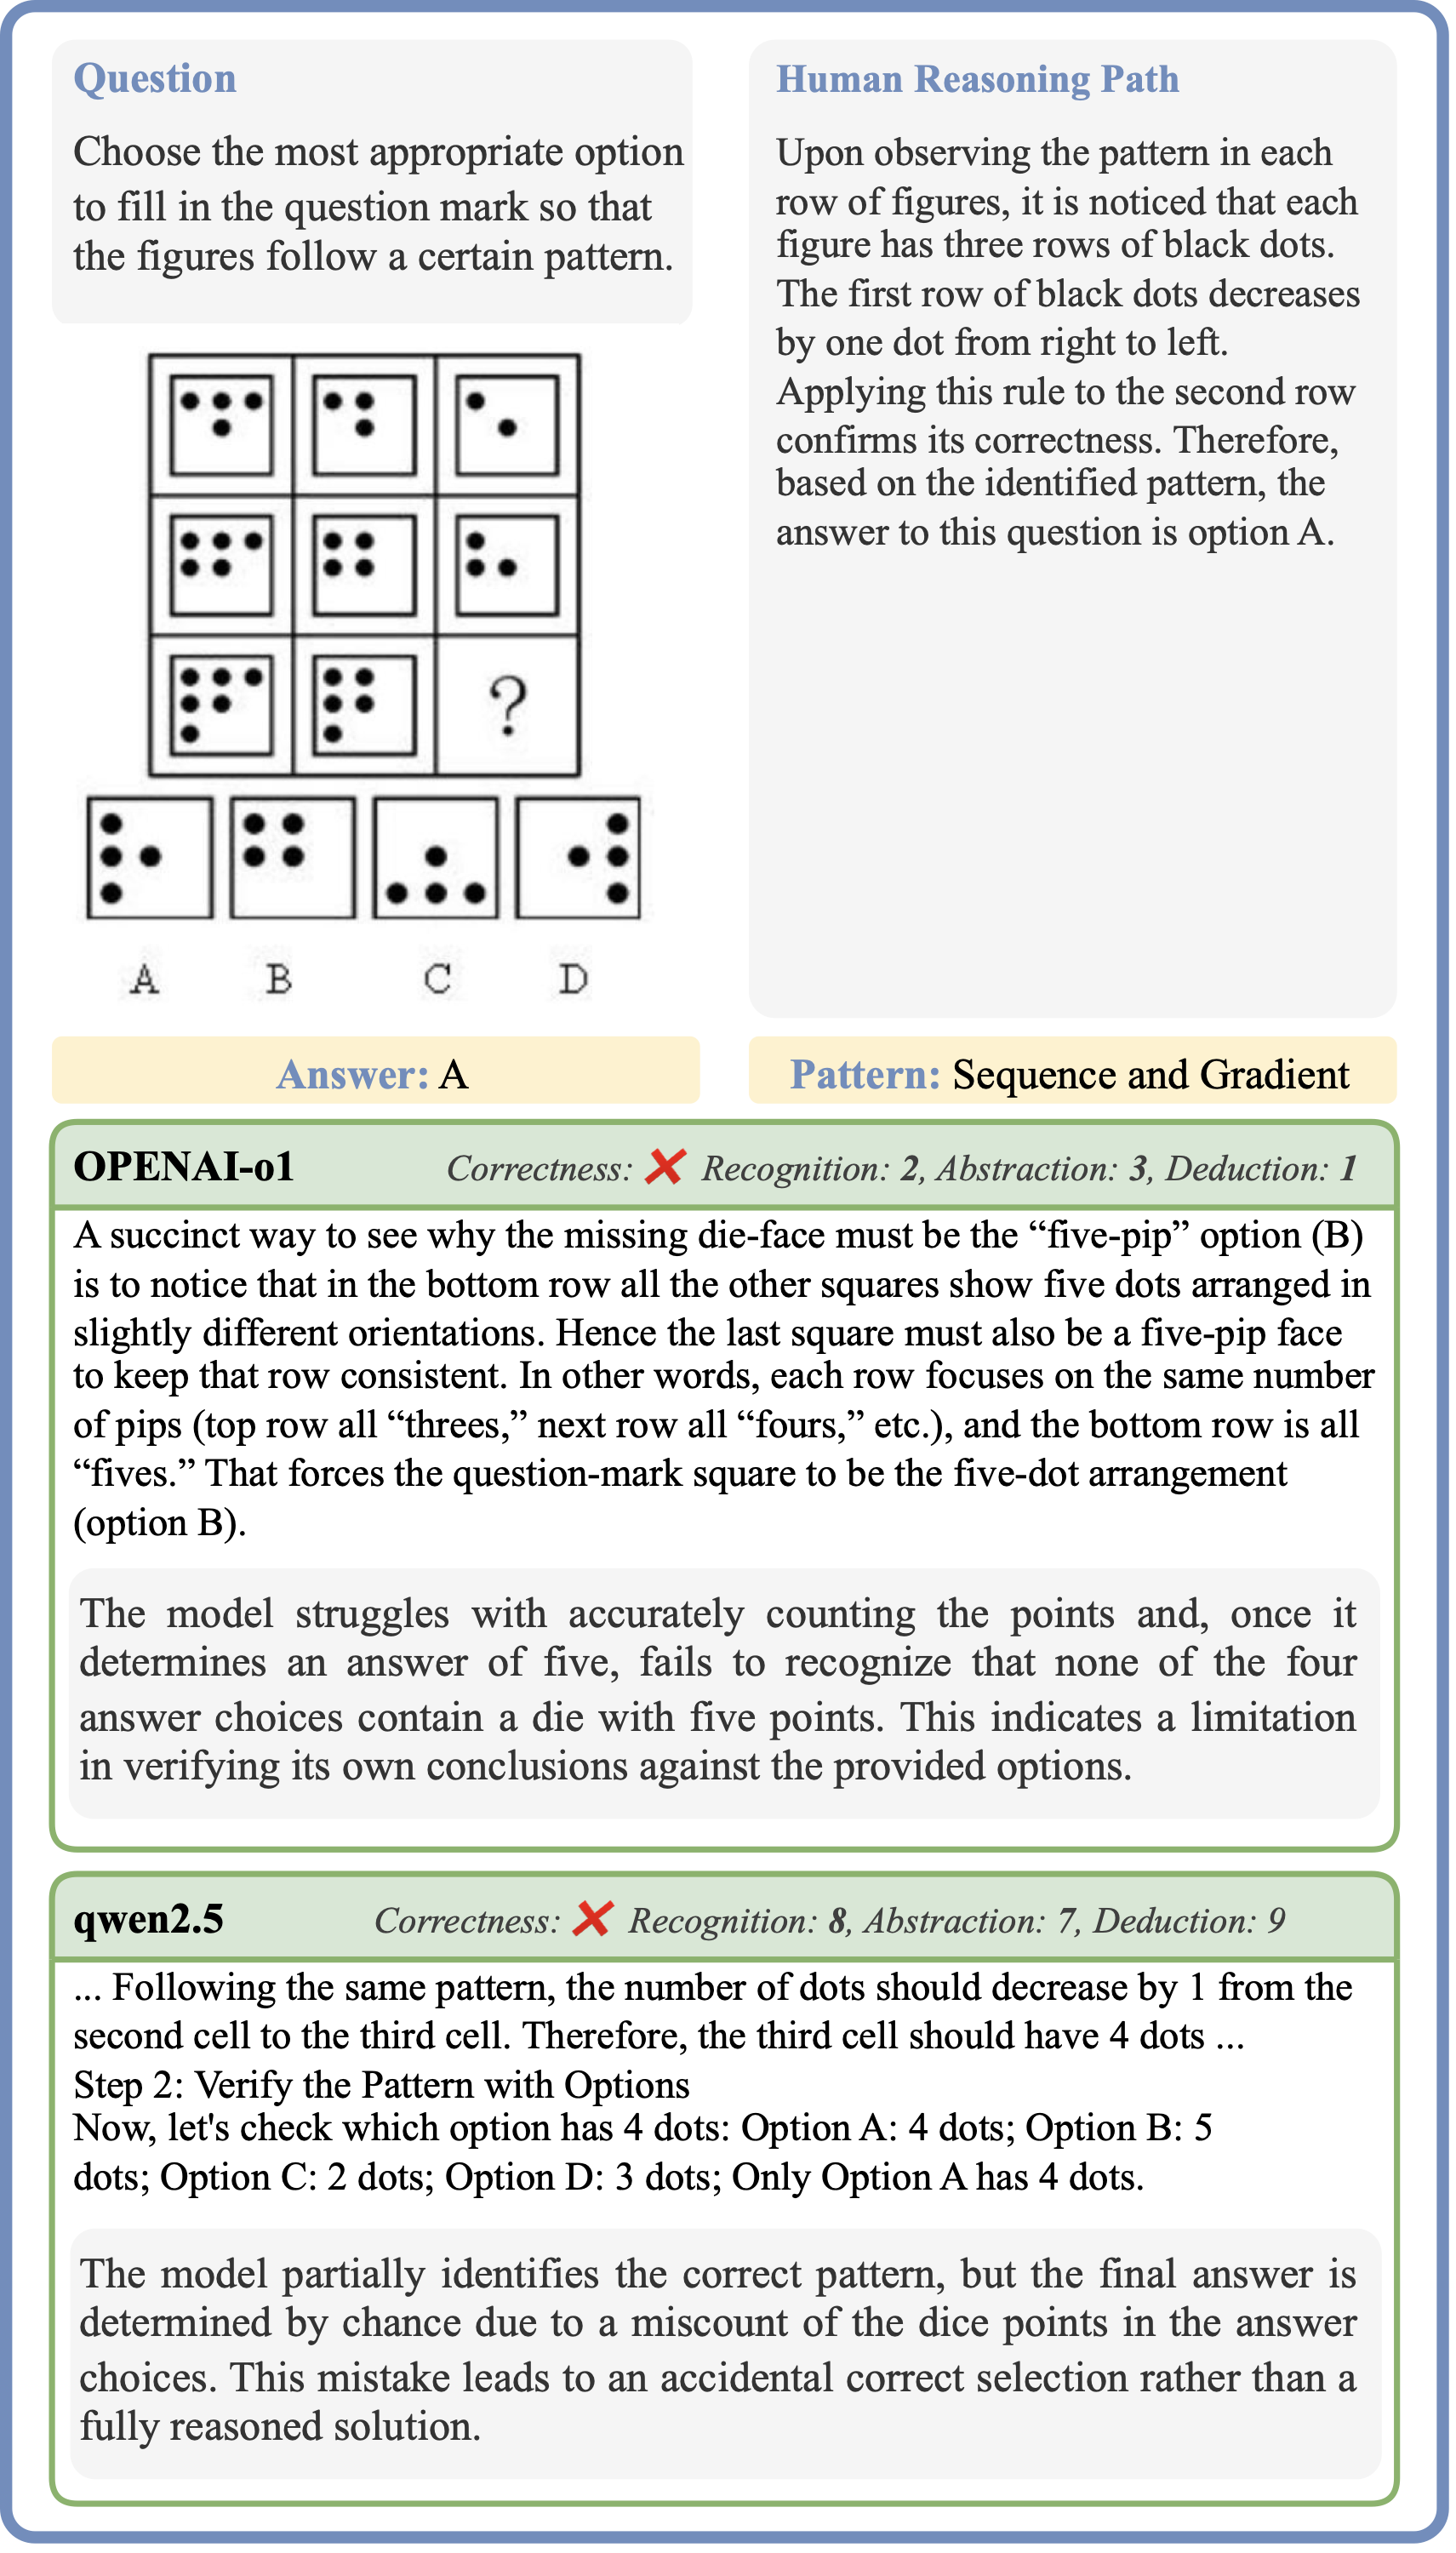
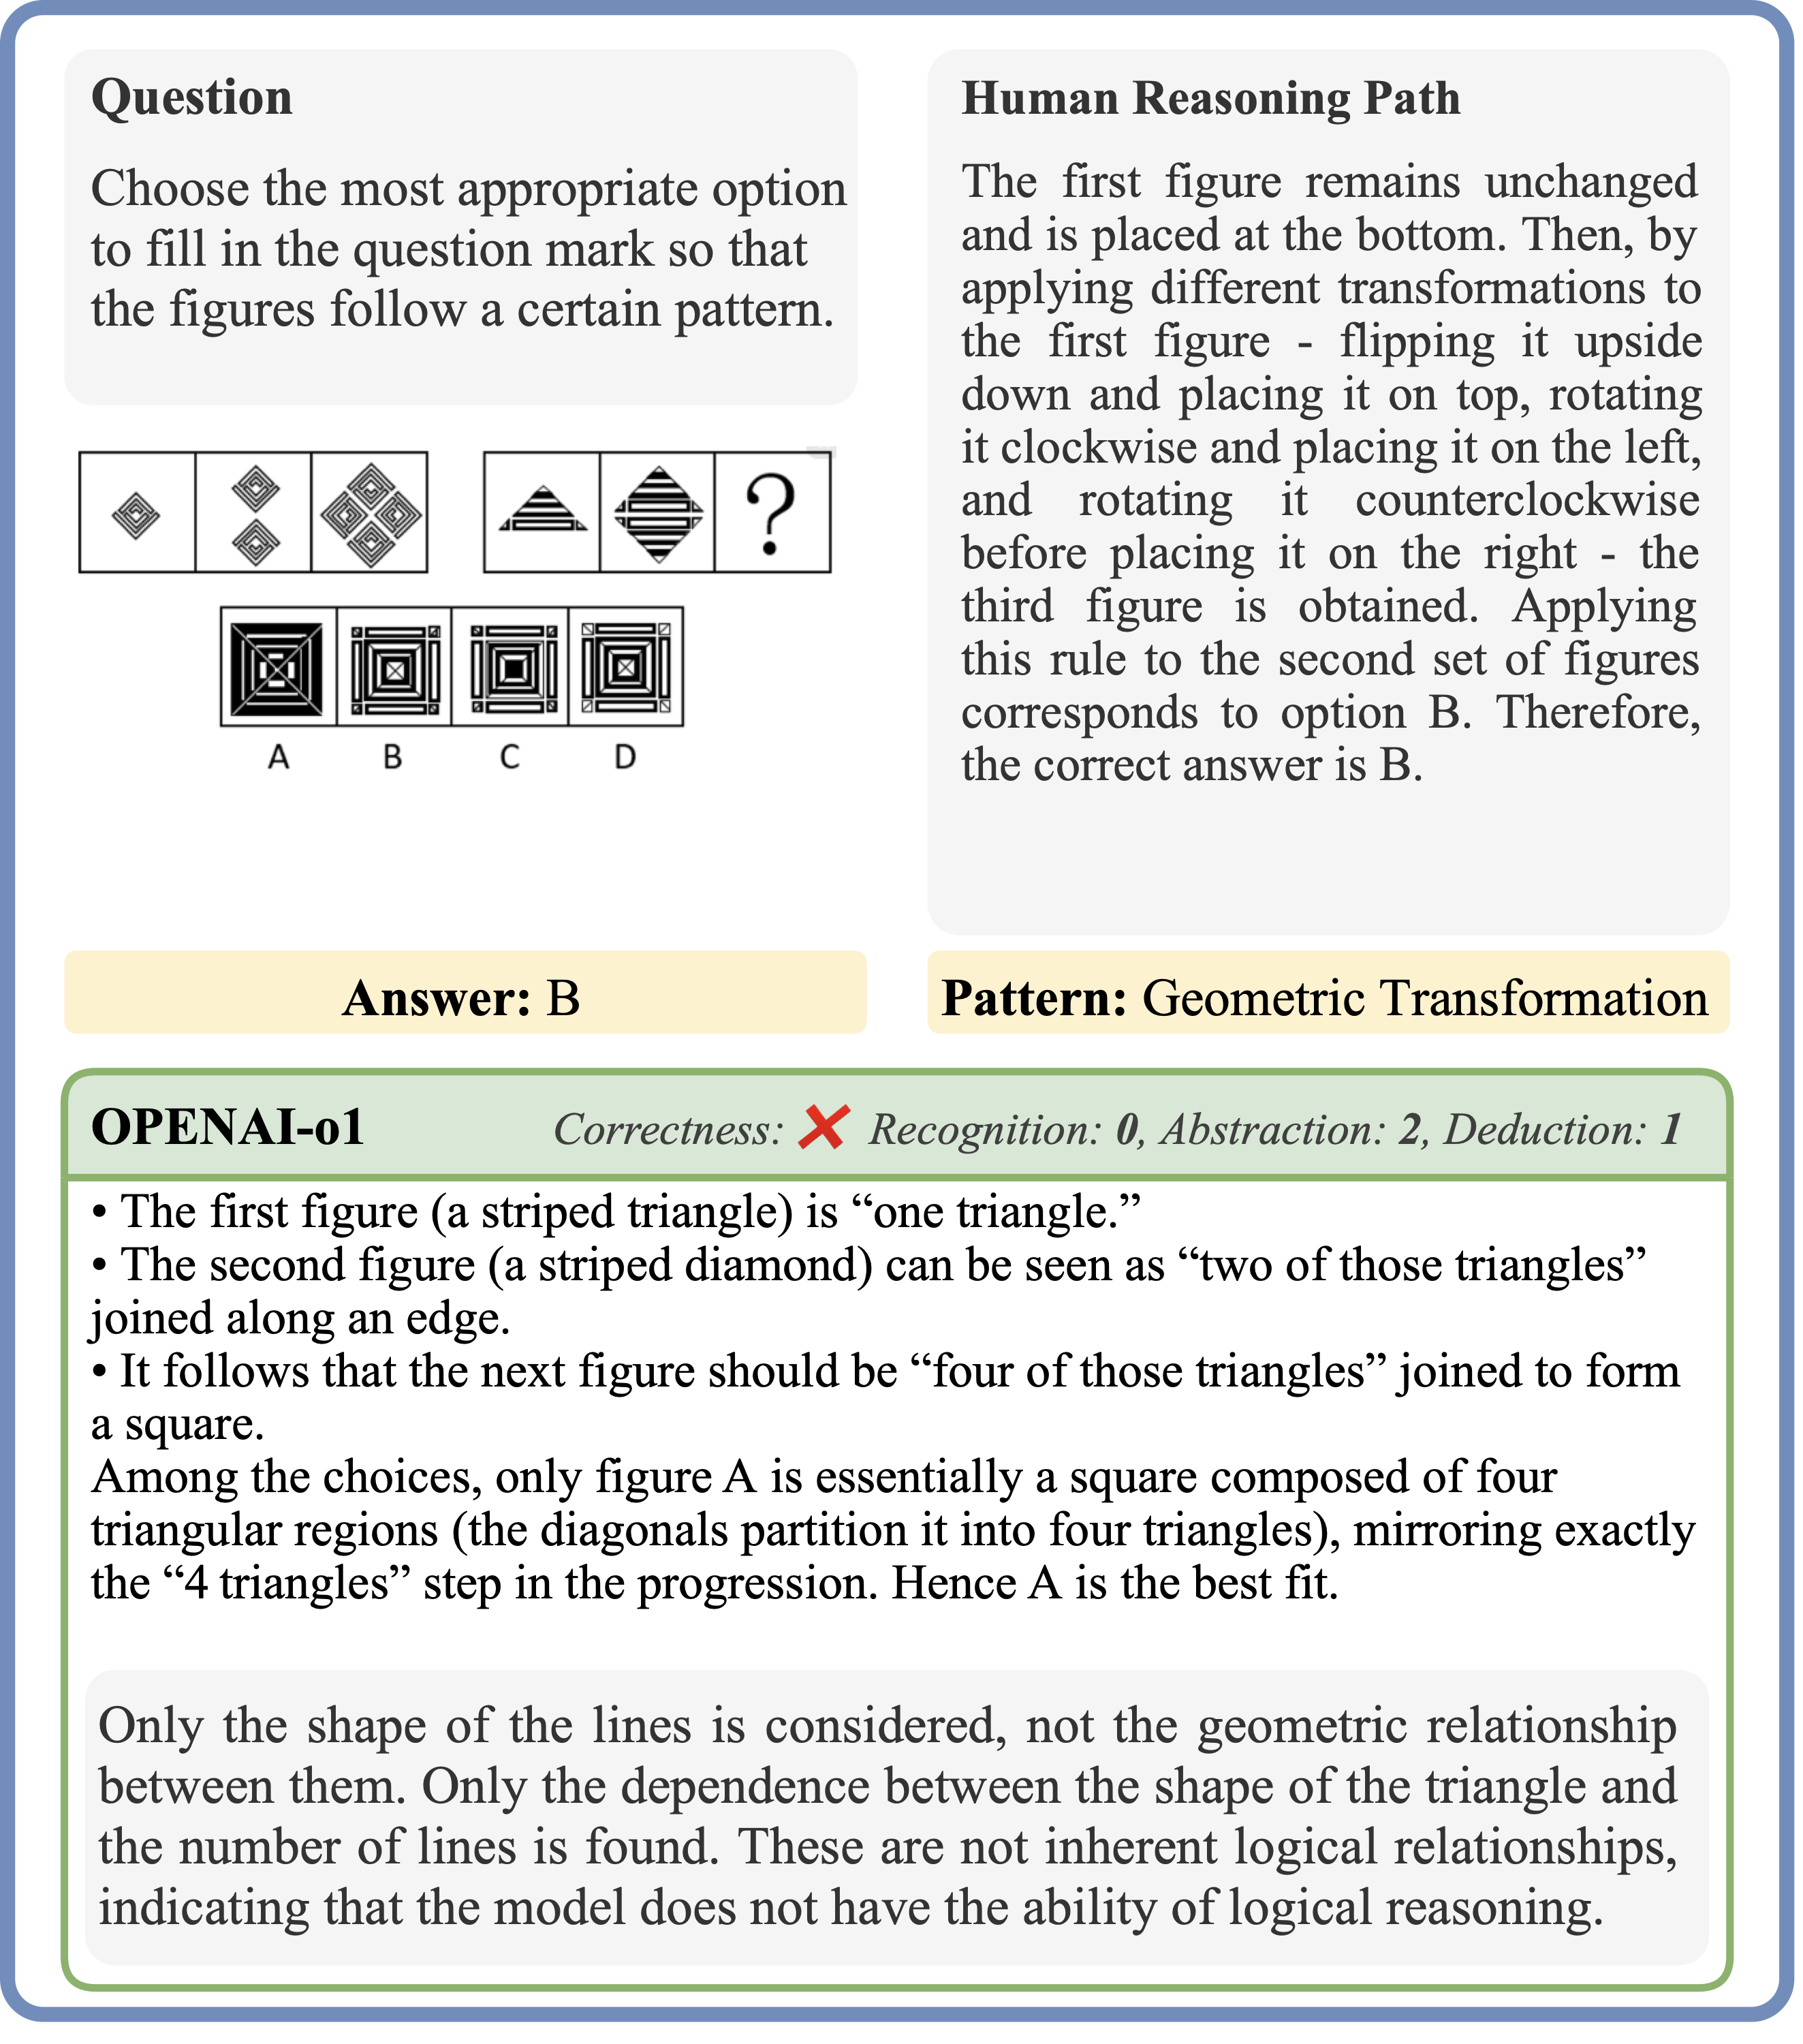
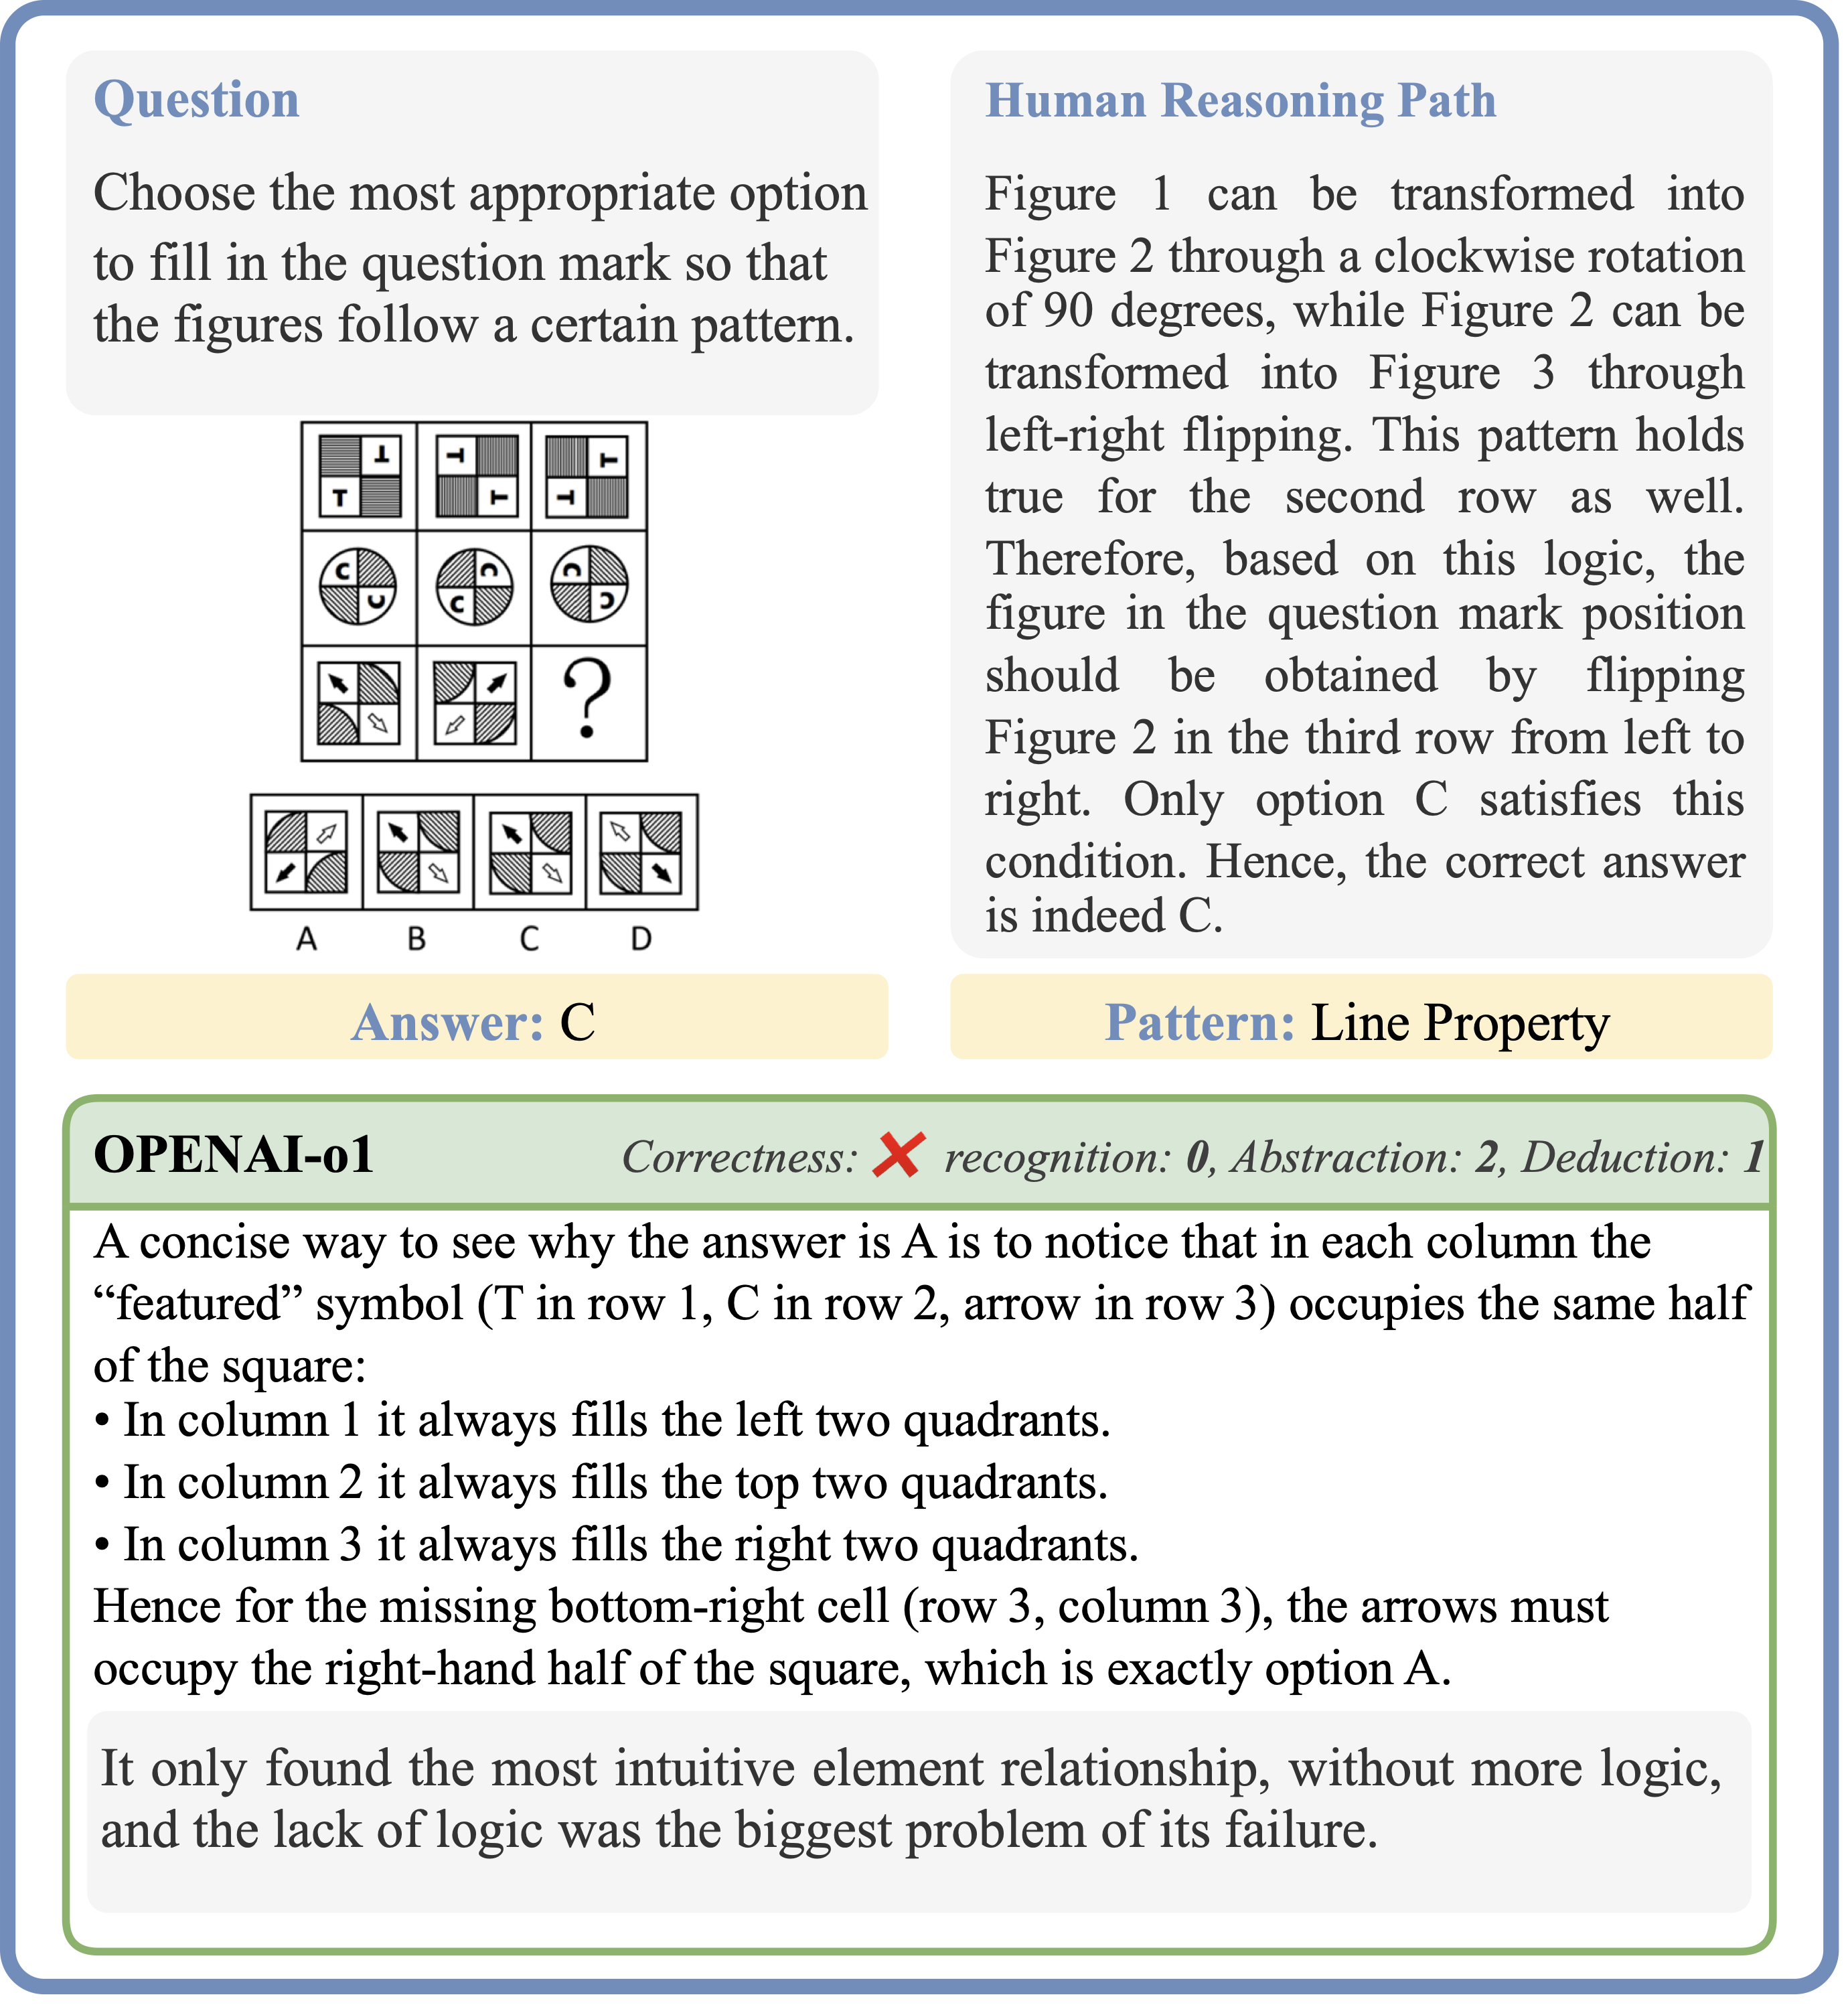
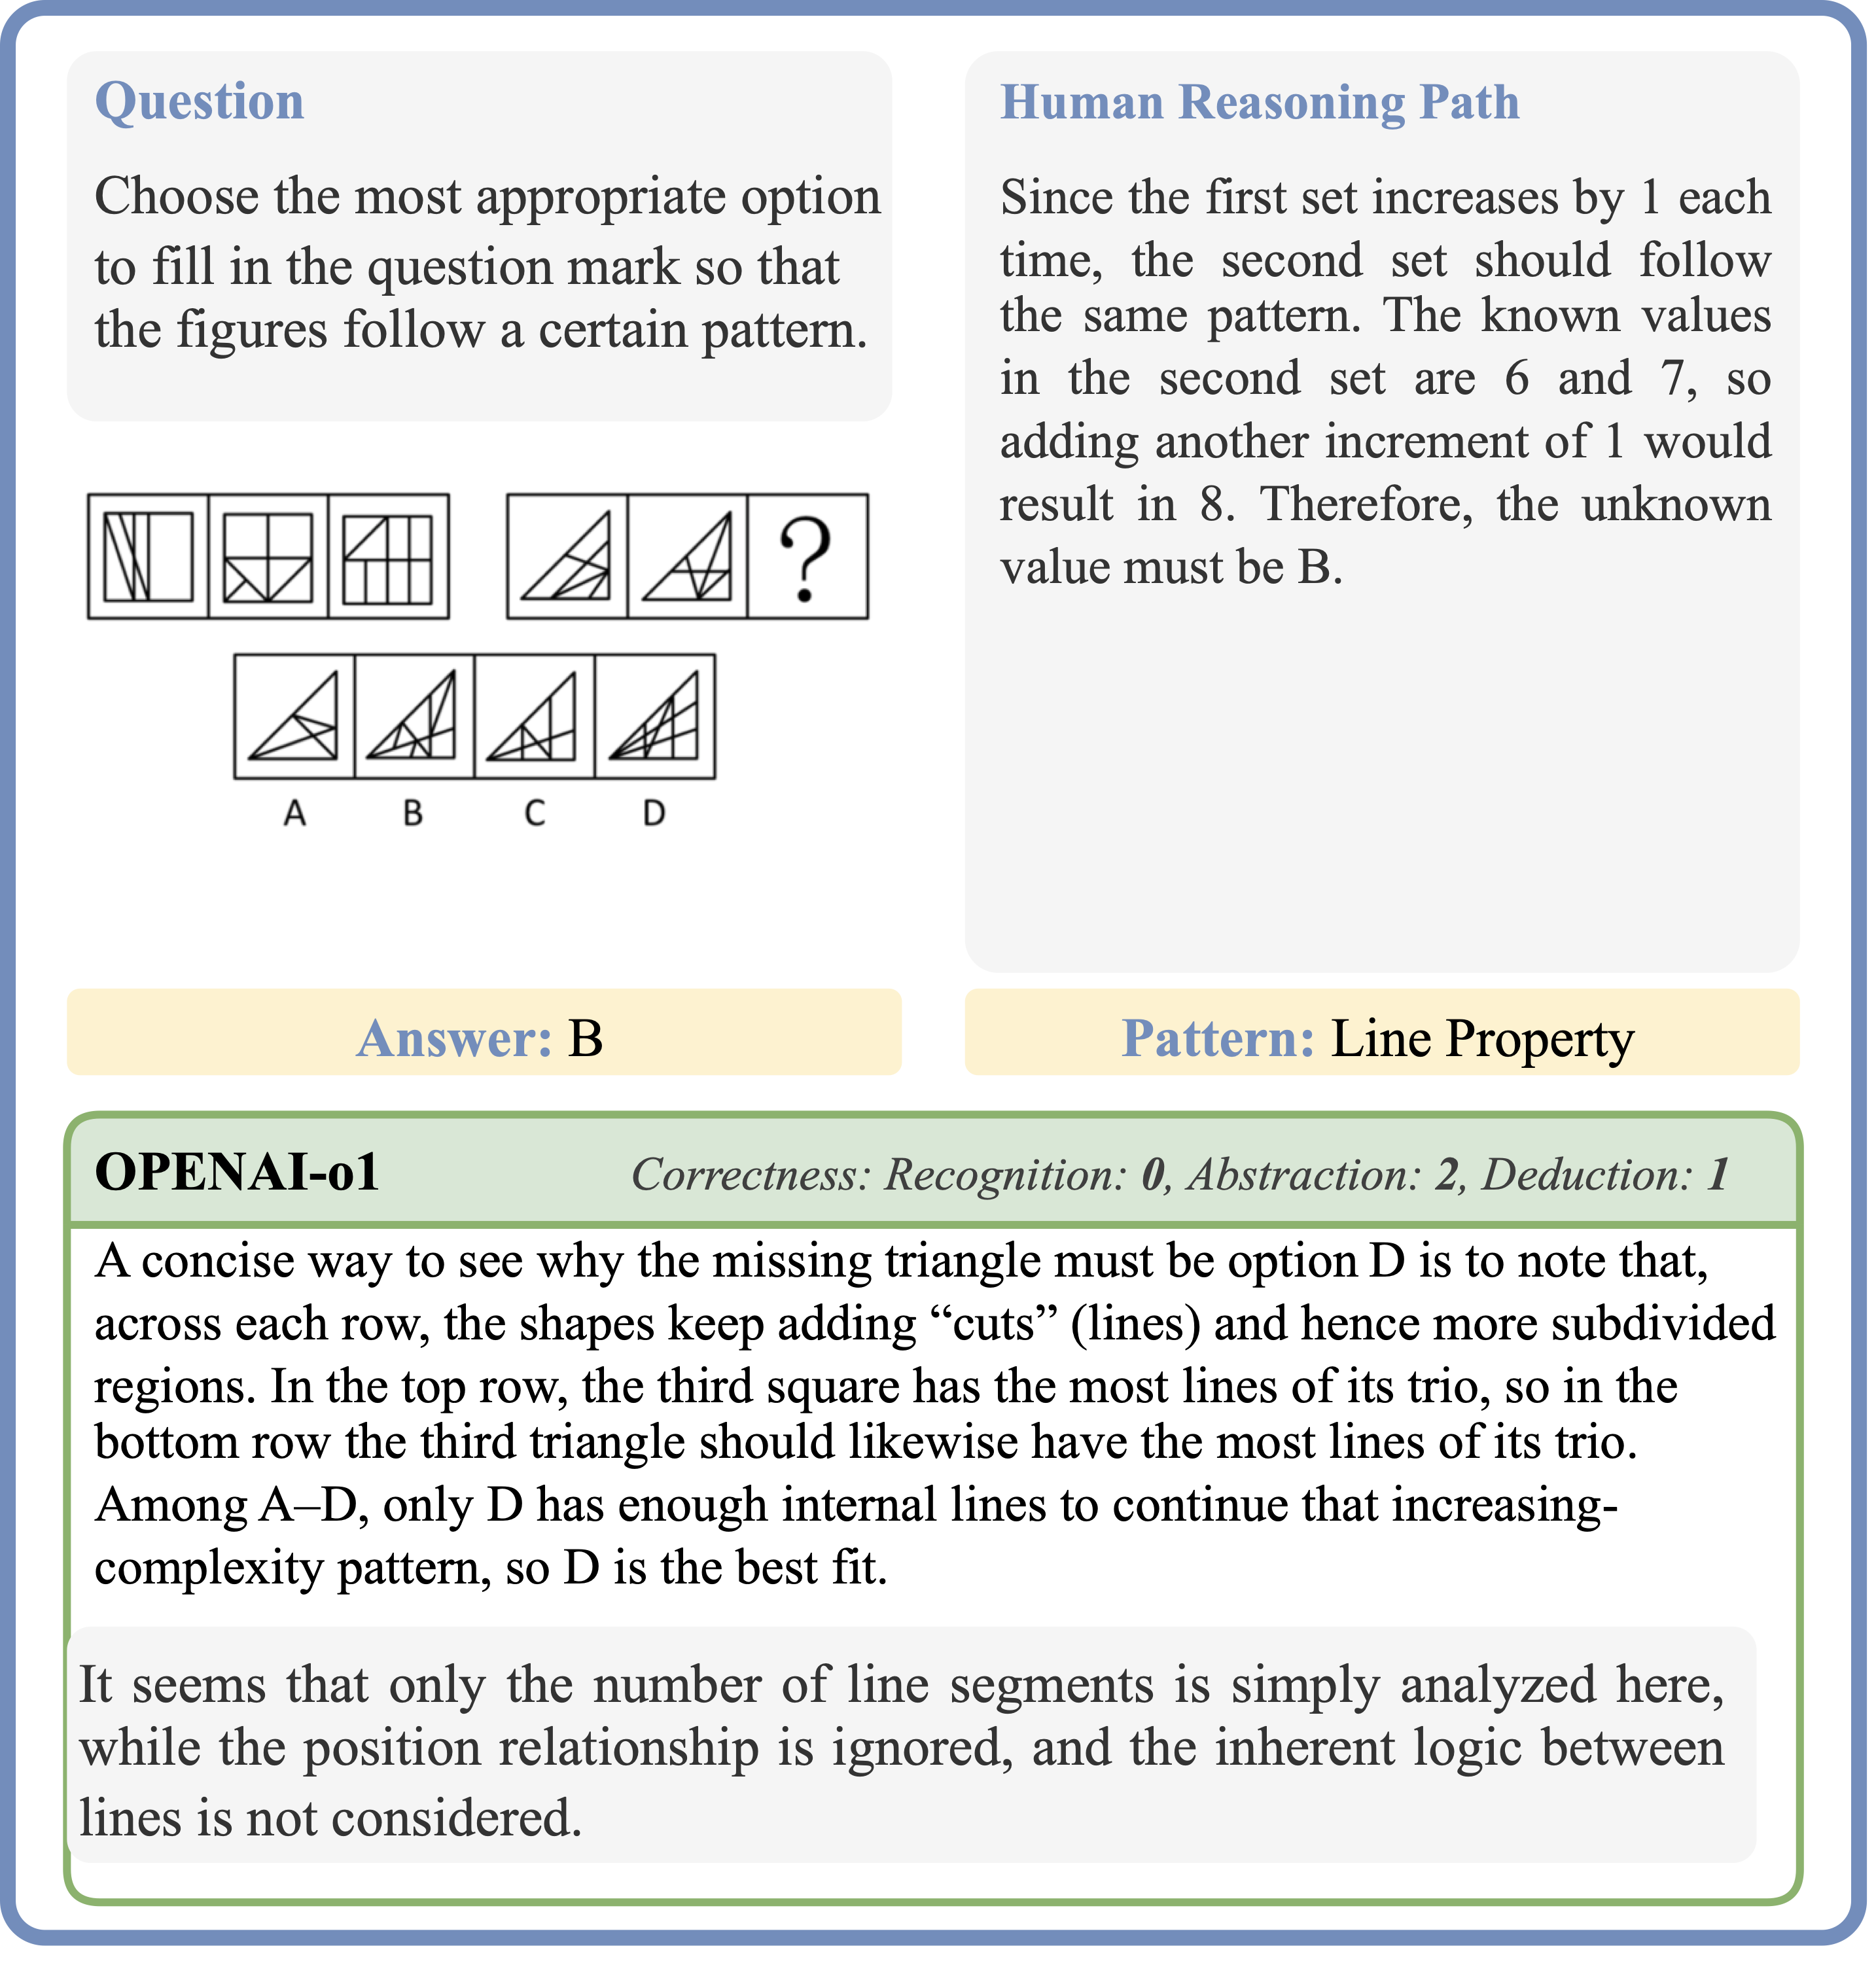
IV. More Qualitative results
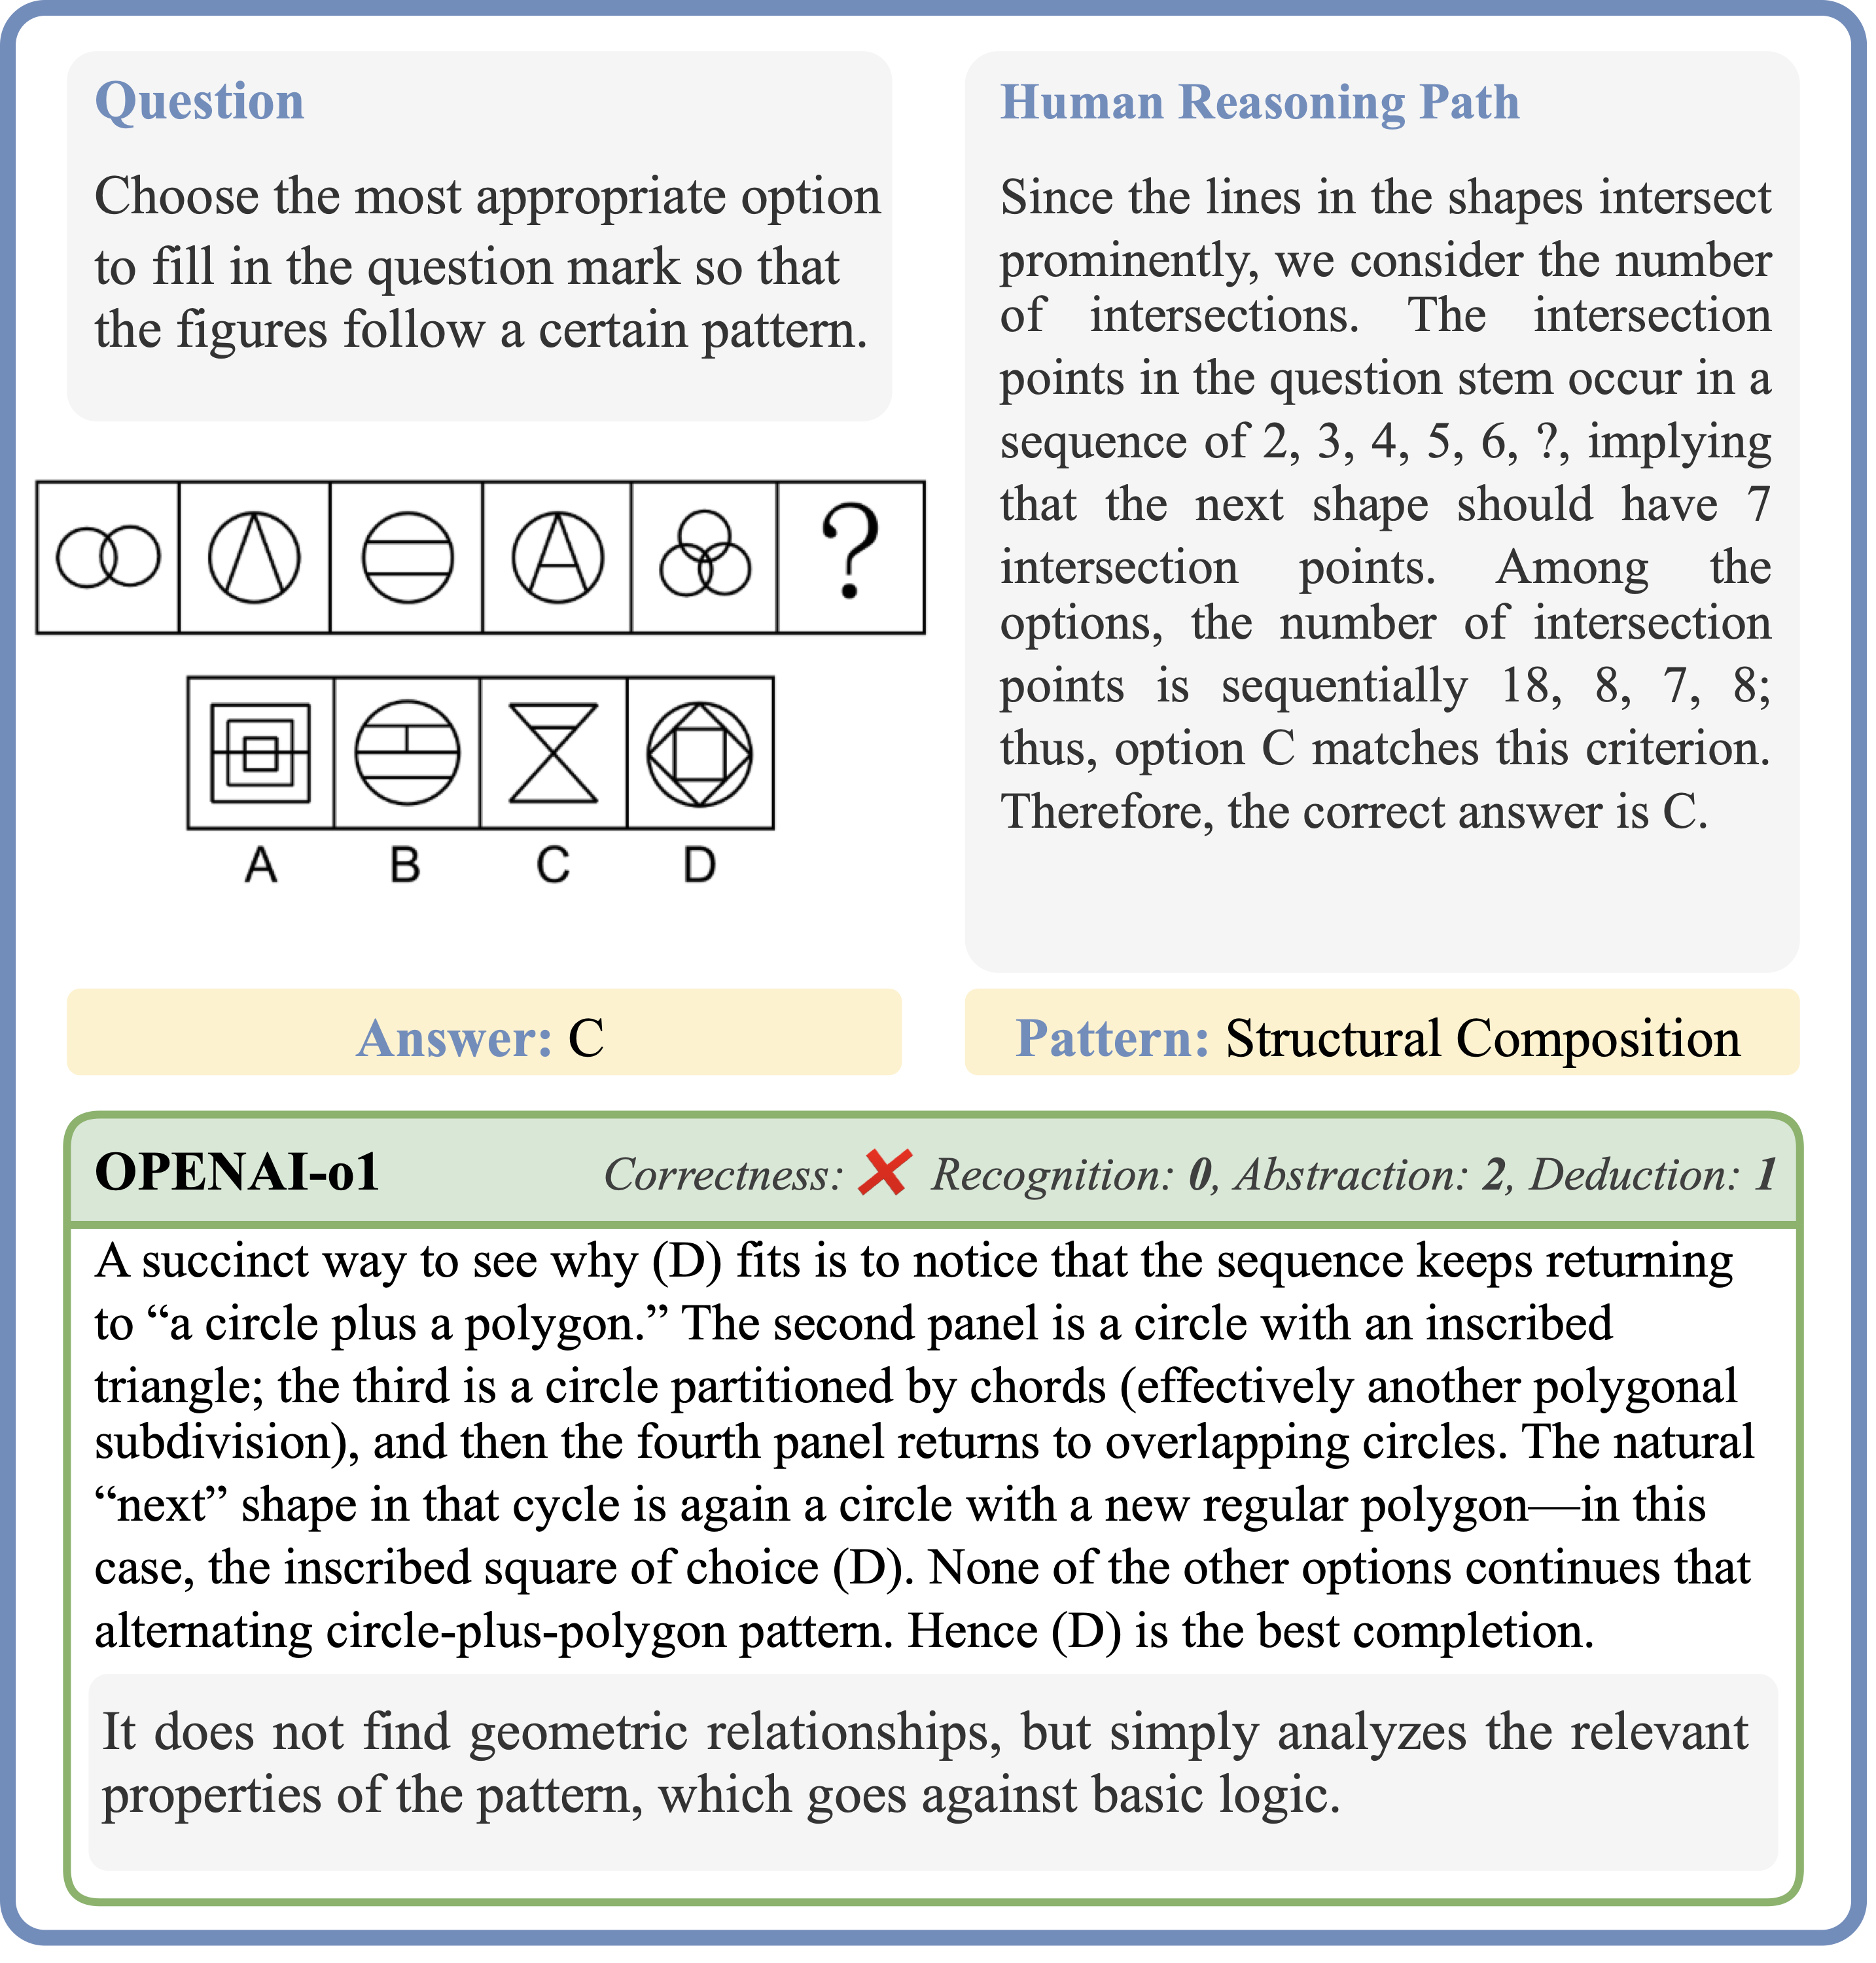
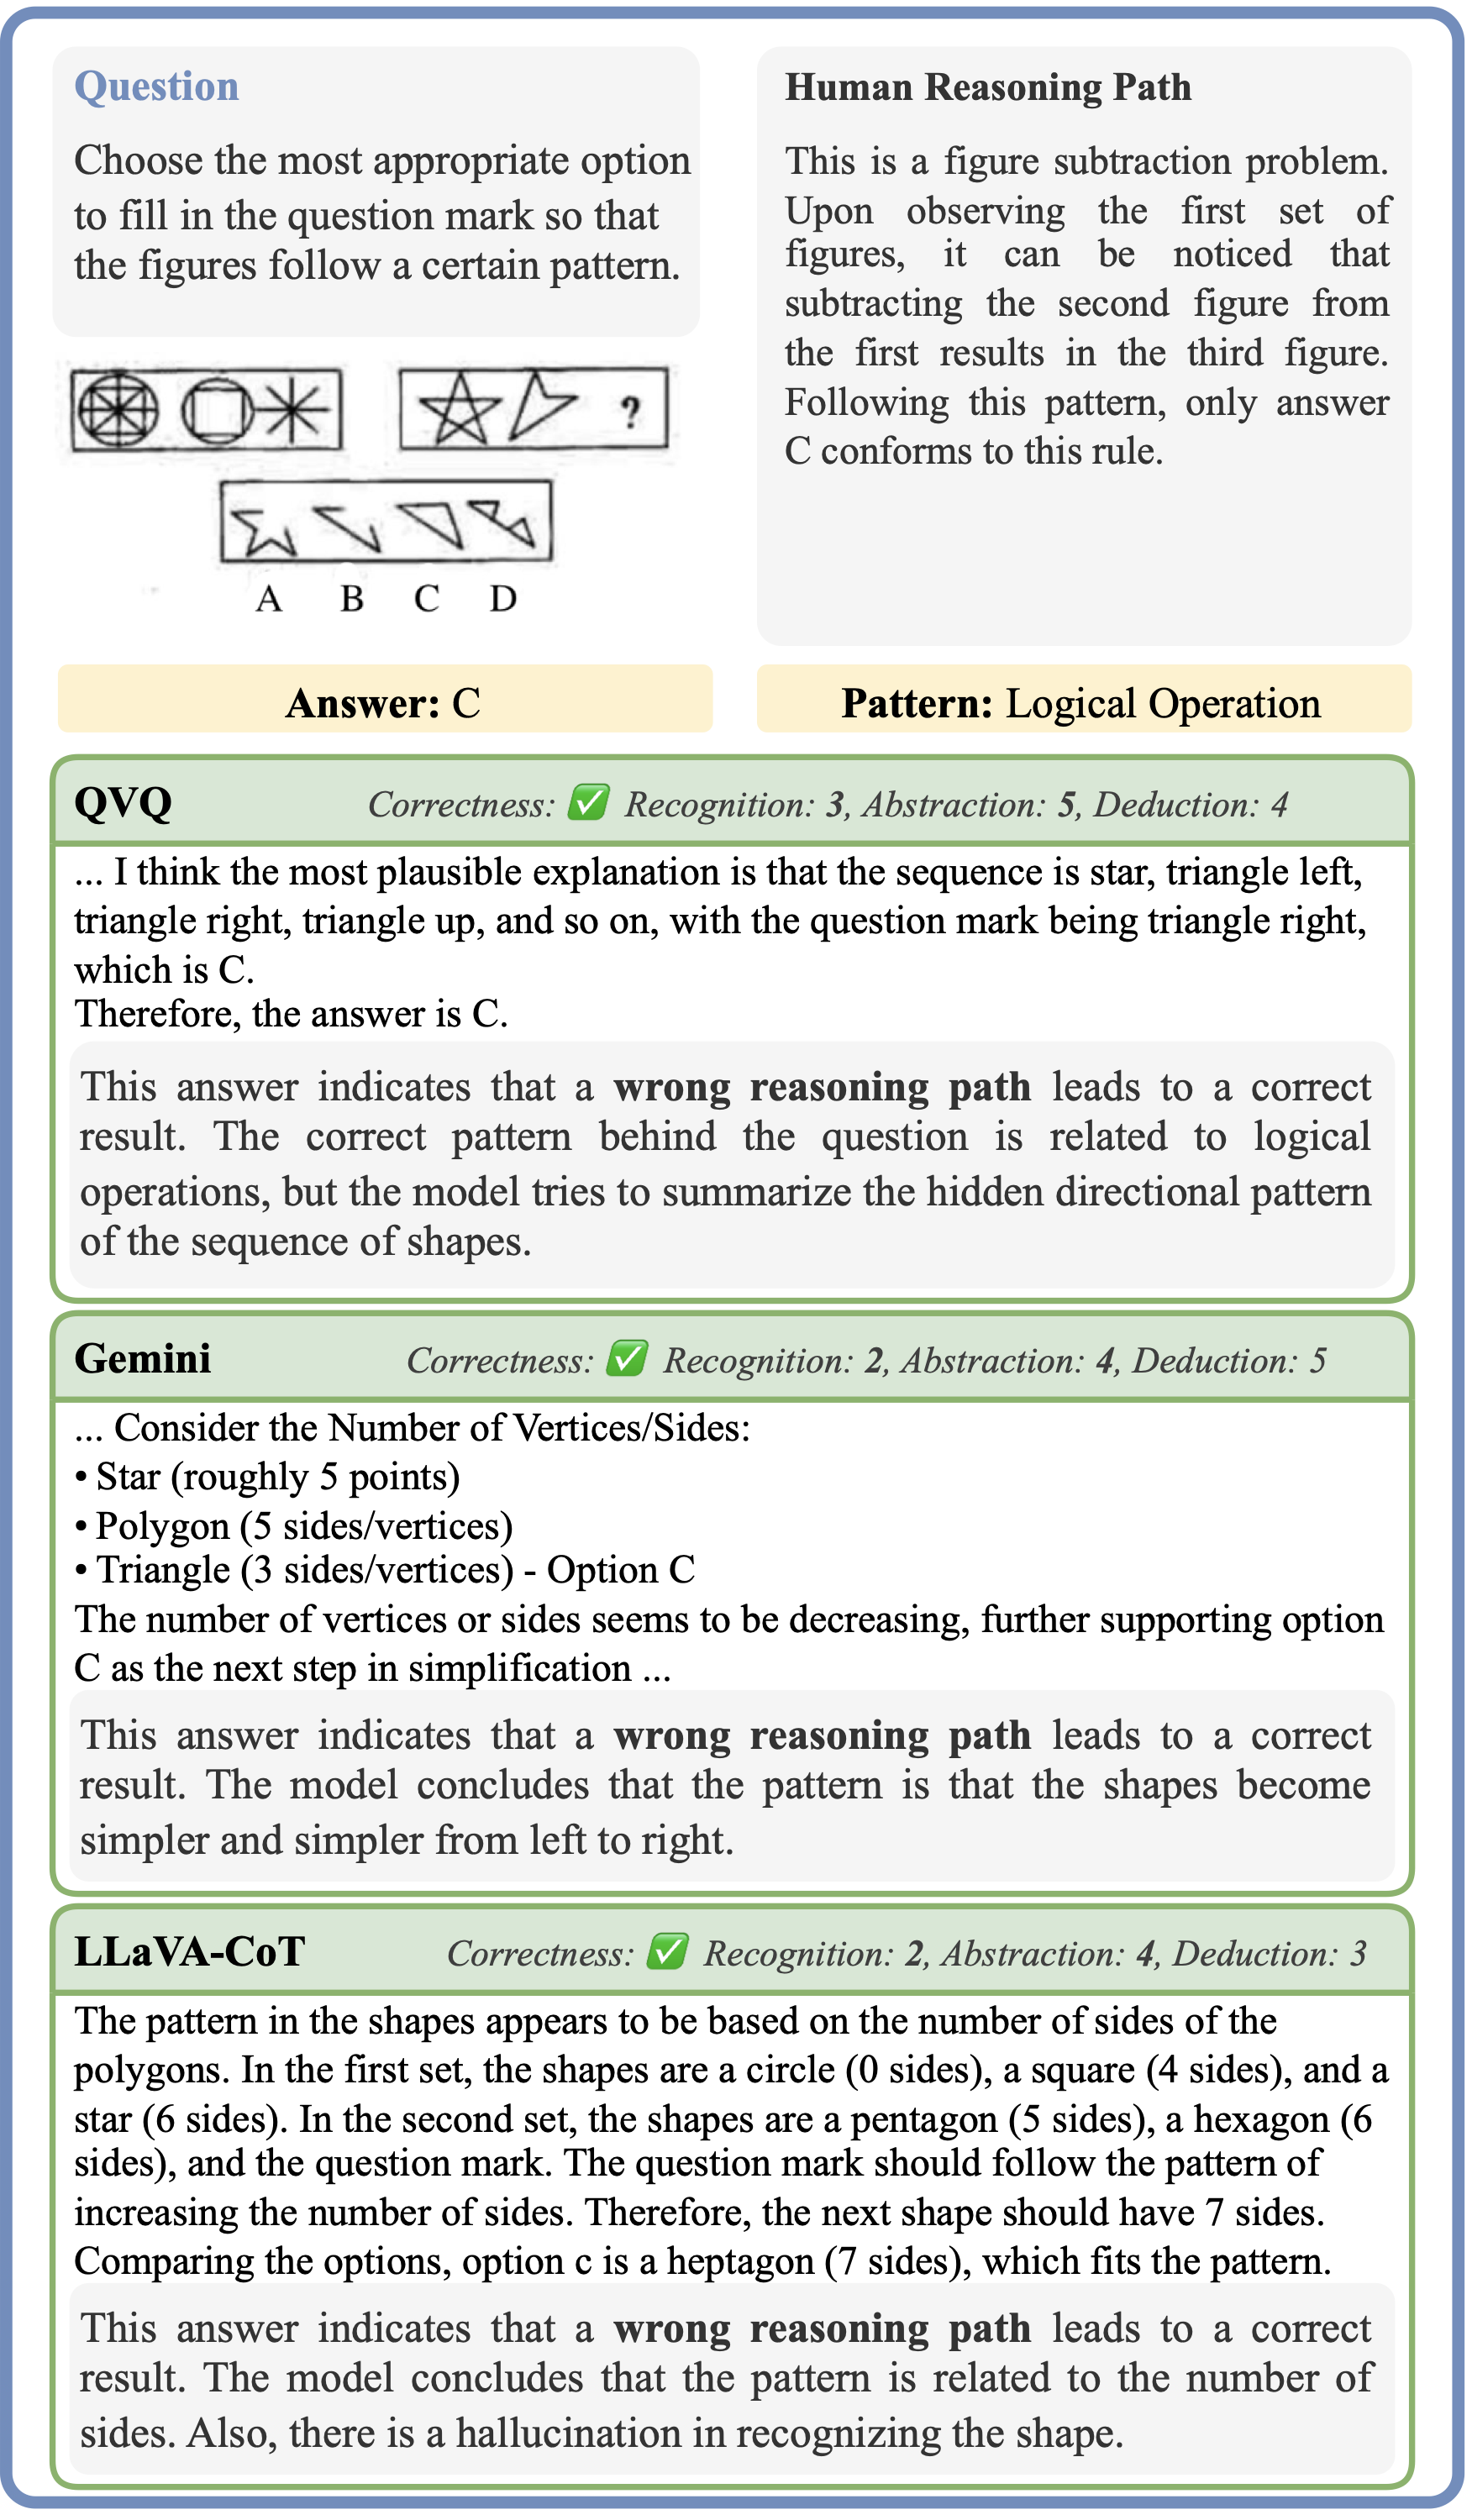
This is a detailed case study that explores the question from multiple perspectives, including reasoning
paths from various models and insights from human analysis. We have identified a few recurring mistake
patterns:
Misinterpreting Features: Errors stem from inaccurate element counts or misestimating
numerical patterns.
Reliance on Intuition: Mistakes occur when decisions are based on surface-level visual
trends rather than logical transformations.
Failure to Verify All Options: Incorrect answers can result from choosing seemingly
correct options without considering all possibilities.